Buy– Signal generated on the close of December 31 (click here for more details)
today’s watchlist (potential trade entries):

Having trouble seeing the open positions graphic above? Click here to view it directly on your web browser instead.
open positions:
Below is an overview of all open positions, as well as a report on all positions that were closed only since the previous day’s newsletter. Net P/L figures are based on two separate $50,000 model portfolios (one for ETFs and one for stocks). Changes to open positions since the previous report are listed in pink shaded cells below. Be sure to read the Wagner Daily subscriber guide for important, automatic rules on trade entries and exits.
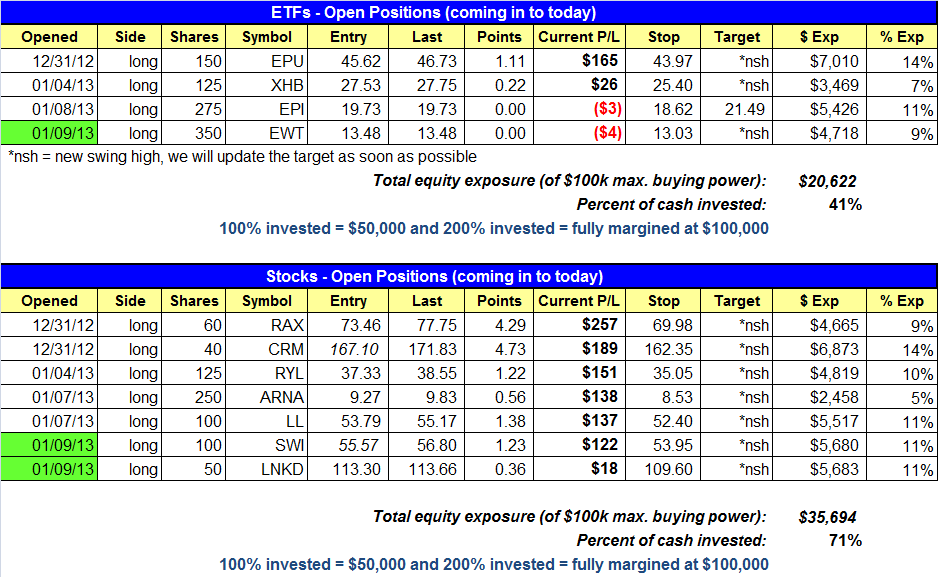
Having trouble seeing the open positions graphic above? Click here to view it directly on your web browser instead.
closed positions:

Having trouble seeing the closed positions graphic above? Click here to view it directly on your web browser instead.
ETF position notes:
- $EWT trade triggered.
stock position notes:
- $LNKD and $SWI entries triggered. Cancelled $REGN buy setup.
ETF, stock, and broad market commentary:
Stocks closed higher across the board on Wednesday, with small and mid-cap stocks leading the way and closing near the highs of the day. Large cap stocks in the S&P 500 and Nasdaq 100 were noticeably weaker, as they struggled to closed above the mid-point of the day’s range.
Total volume was slightly higher on the NYSE by 1.3%. However, since the S&P 500 did not close at the lows of the day we see no reason to label yesterday’s trading as churning. Churning happens when an index or stock climbs above the prior day’s high intraday but can not hold and sells off, usually closing in the bottom half of the day’s range. Volume was 2.8% lighter on the Nasdaq. As mentioned yesterday, the volume pattern in the broad market remains bullish.
We added one new position to the ETF portfolio yesterday in $EWT. For those who have yet to enter $EPI, a move above yesterday’s high is a valid entry point using the stop we already have in place.
Market Vectors-Coal ($KOL) continues to chop around after clearing the 200-day MA on Jan. 2. It has been trading below the 26.25 – 23.35 breakout pivot on light volume the past two days. Ideally, we would like to see the price action pullback to the 200-day MA and form some sort of bullish reversal candle. The area we are looking at is somewhere between the 20-day EMA and 200-day SMA on the chart below.

Although we would prefer a pullback entry, a breakout entry may be in order if $KOL continues to hold up near the highs of the range. We will continue to monitor the action for a valid entry point.
The monthly chart of $KOL is quite clear. After breaking above the downtrend line, $KOL has developed a tight base off the lows over the past six months and appears ready to breakout.

Since topping out in September, the SPDR Dow Jones Global Real Estate ($RWO) has formed a bullish base that held the 50-day MA for the most part except for a little shakeout in mid-November to the 200-day MA. Since the shakeout the price action has been quite bullish, setting several higher highs and lows along the way, while holding above the 20-day EMA. All the moving averages are trending higher and in the proper order, with the 20 EMA above the 50 MA, and the 50 MA above the 200 MA. $RWO has tightened up nicely the past fews which is why we are listing it as an official buy setup. If our entry does not trigger right away and $RWO comes in a bit, we might be able to grab a pullback entry off the 20-day EMA. Trade details can be found in the watchlist section above.

On the stock side, we added two new positions to the portfolio in $LNKD and $SWI. $SWI closed up over 3% on a decent pick up in volume. $LL closed at the lows of the day, giving back all gains. If the price action does not hold above Wednesday’s low, then we could see a few more days of weakness before the stock is ready to run higher.
We do not mind adding 2-3 more positions to the portfolio but for today we are sitting tight with current positions, as there are no new setups.
If you are a new subscriber, please e-mail [email protected] with any questions regarding our trading strategy, money management, or how to make the most out of this report.
relative strength combo watchlist:
Our Relative Strength Combo Watchlist makes it easy for subscribers to import data into their own scanning software, such as Tradestation, Interactive Brokers, and TC2000. This list is comprised of the strongest stocks (technically and fundamentally) in the market over the past six to 12 months. The scan is updated every Sunday, and this week’s RS Combo Watchlist can be downloaded by logging in to the Members Area of our web site.