market timing model:
Buy – Signal generated on the close of August 16 (click here for more details)
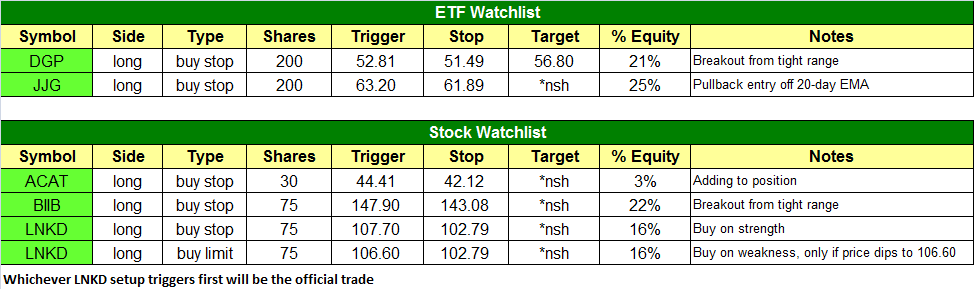
today’s watchlist (potential trade entries):
Having trouble seeing the open positions graphic above? Click here to view it directly on your web browser instead.
open positions:
Below is an overview of all open positions, as well as a report on all positions that were closed only since the previous day’s newsletter. Net P/L figures are based on two separate $50,000 model portfolios (one for ETFs and one for stocks). Changes to open positions since the previous report are listed in pink shaded cells below. Be sure to read the Wagner Daily subscriber guide for important, automatic rules on trade entries and exits.

Having trouble seeing the open positions graphic above? Click here to view it directly on your web browser instead.
closed positions:
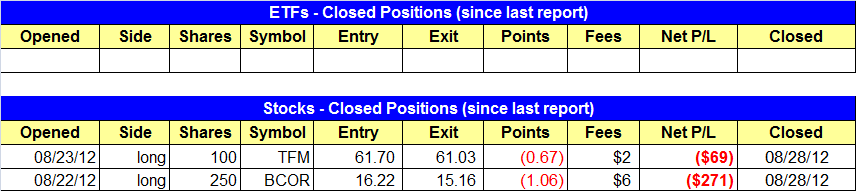
Having trouble seeing the closed positions graphic above? Click here to view it directly on your web browser instead.
ETF position notes:
- No trades were made.
stock position notes:
- Sold TFM at the open for a scratch loss. BCOR sold off sharply and triggered our stop.
ETF and broad market commentary:
It was another day of noncommittal, directionless trading in yesterday’s session, not unlike the previous day. After bit of volatility on the open, stocks settled into a choppy, sideways range throughout the rest of the day. The Nasdaq Composite ($COMPQ) showed a bit of relative strength by eking out a gain of 0.1%, but the S&P 500 ($SPX) slipped 0.1% and the Dow Jones Industrial Average ($DJIA) lost 0.2%. Small and mid-cap issues showed relative strength, as the small-cap Russell 2000 and S&P MidCap 400 rose 0.5% and 0.4% respectively. All the main stock market indexes closed near the middle of their intraday trading ranges.
Turnover was nearly on par with the previous day’s levels. In the NYSE, total volume ticked 4% higher, while trading in the Nasdaq was 3% lighter than the previous day’s level. As has been the case for nearly the entire month, trading remained below 50-day average levels. In both exchanges, declining volume marginally exceeded advancing volume. The slightly higher volume in the NYSE, combined with a small loss in the S&P 500, caused the index to register a bearish “distribution day.” Still, we have not seen enough instances of selling amongst banks, mutual funds, hedge funds, and other institutions to signal the end of the current uptrend.
In yesterday’s commentary, we said there were three ETFs on our “unofficial” watchlist that we were monitoring for potential buy entry in the near-term. They were: SPDR Gold Trust ($GLD), iPath Grains ETN ($JJG), and S&P Health Care SPDR ($XLV). Of these three, we are now adding to of them to our “official” ETF trading watchlist for potential buy entry today. The first is $GLD, which has now formed a tight “bull flag” formation over the past four days. But rather than buying $GLD, we are targeting the leveraged Gold Double Long ETN ($DGP) for buy entry instead. As annotated on the chart below, our buy trigger for $DGP will be a breakout above the 4-day high (subscribers should note our exact entry, stop, and target prices in the ETF Watchlist section of today’s newsletter above):

Although leveraged ETFs like $DGP have a tendency to underperform the nonleveraged ETFs over longer holding periods, some of these ETFs are fine for trading shorter-term, momentum-driven trades, while providing the benefit of using less capital to achieve potential upside gains.
In addition to $DGP, we are now also targeting $JJG for “official” buy entry. Yesterday, it provided us with the slight pullback we were looking for and bounced perfectly off of support of its 20-day exponential moving average. As such, we are now looking for a buy entry above yesterday’s high, with a stop below the 20-day exponential moving average (plus some “wiggle room”). Again, subscribers should note our exact trade parameters on our watchlist above. The setup in $JGG is shown below:

Despite the relatively flat closing prices in the broad market, all but one of the 8 open positions in our model trading portfolios (6 individual stocks and 2 ETFs) showed relative strength to the major indices by rallying moderately higher. As we frequently mention, the only time we really pay much attention to the performance of the main stock market indexes is when it comes to instances of heavier volume gains (“accumulation days”) or heavier volume declines (“distribution days”). More importantly, we are concerned with how well individual positions perform. When we are doing our jobs by simply selecting positions with solid bases of consolidation and relative strength, it frees us from the concern and worry of having to pay much attention to how much the Dow moves up or down every day (unlike the talking heads of financial news networks who constantly dwell only on the performance of the popular market indexes). For now, our objective, rule-based market timing model remains in buy mode, so we will continue to be positioned on the long side of the market.
stock commentary:
We continue to see bullish chart patterns form, which is a good sign for the health of the rally. We have a buy stop order to add 30 shares to ACAT on a move above yesterday’s high. We also like BIIB for a breakout entry above the three day high with a pretty tight stop of just over 3%.
LNKD cleared the tight, five day range on a pick up in volume which is detailed on the chart below. We have two possible entry scenarios on LNKD. The first scenario to trigger will be the official trade and the other setup is canceled. The entry on strength (buy stop order) is over yesterday’s high so that we do not miss the move out. However, if LNKD pulls back in tomorrow we have a buy limit order set to trigger IF the price action sells off to the 106.60 level. The buy limit order will only trigger if LNKD falls to 106.60.

If you are a new subscriber, please e-mail [email protected] with any questions regarding our trading strategy, money management, or how to make the most out of this report.
relative strength combo watchlist:
Our Relative Strength Combo Watchlist makes it easy for subscribers to import data into their own scanning software, such as Tradestation, Interactive Brokers, and TC2000. This list is comprised of the strongest stocks (technically and fundamentally) in the market over the past six to 12 months. The scan is updated every Sunday, and this week’s RS Combo Watchlist can be downloaded by logging in to the Members Area of our web site.