market timing model: BUY
Current signal generated on close of November 13.
Portfolio exposure can be anywhere from 50 to 100% long. If positions are holding up well, then one can add exposure beyond 100%.
Past signals:
- Neutral signal generated on close of November 6.
- Buy signal generated on close of September 9
- Neutral signal generated on close of August 15
- Buy signal generated on close of July 11
- Neutral signal generated on close of July 5
- Sell signal generated on close of June 24
today’s watchlist (potential trade entries):

Having trouble seeing the open positions graphic above? Click here to view it directly on your web browser instead.
open positions:
Below is an overview of all open positions, as well as a report on all positions that were closed only since the previous day’s newsletter. Changes to open positions since the previous report are listed in pink shaded cells below. Be sure to read the Wagner Daily subscriber guide for important, automatic rules on trade entries and exits.

Having trouble seeing the open positions graphic above? Click here to view it directly on your web browser instead.
closed positions:

Having trouble seeing the closed positions graphic above? Click here to view it directly on your web browser instead.
ETF position notes:
- We removed $EWH from the watchlist for now.
stock position notes:
- $WDAY buy entry did not trigger due to 5-minute rule. Note that we changed the entry price and that the 5-minute rule will not apply.
ETF, stock, and broad market commentary:
Stocks consolidated in a tight range yesterday, digesting the prior day’s strong advance. The price action in the S&P 500, NASDAQ Composite, and Dow Jones was ideal, as all three indices basically formed a tight-ranged, inside day.
Small and mid-caps stocks were relatively weak, but still closed above the mid-point of Thursday’s candle.
Turnover declined on both exchanges, which is what we would expect from a narrow ranged trading session.
Guggenheim Shipping ETF ($SEA) rallied 20% or so off the 200-day MA before stalling out around $20 in late October. Since then, $SEA has formed a very tight base around the 10-week MA (light blue line). The correction has been more by time than price, as $SEA hasn’t pulled back much off the swing high.
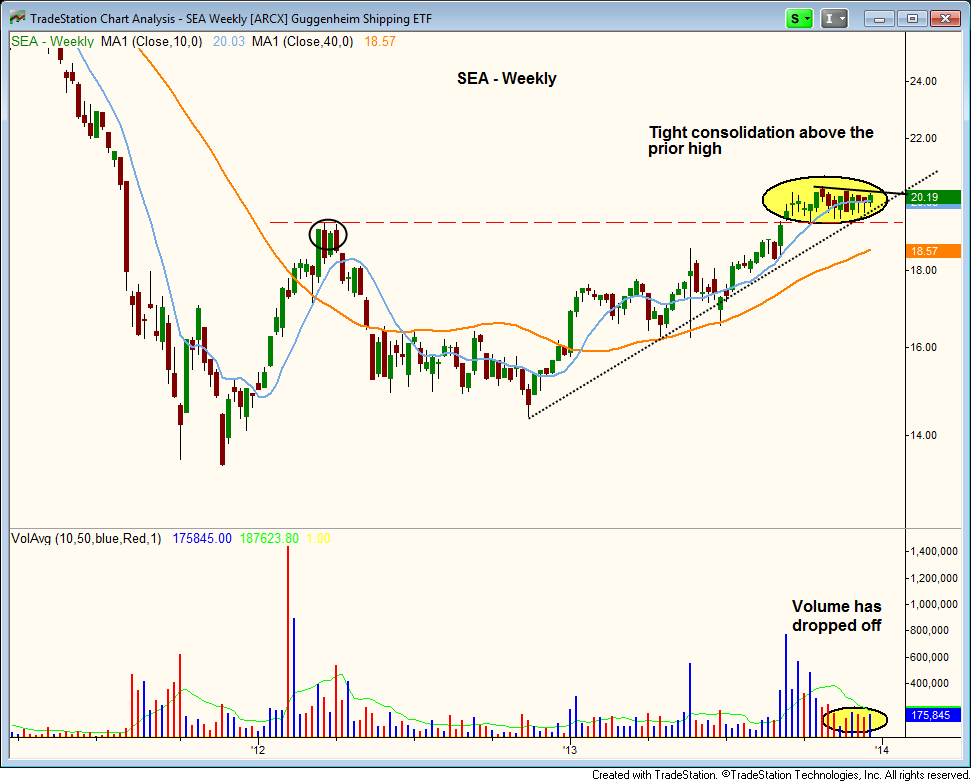
Note the dry up in volume in the base, which is the result of traders exiting once the momentum is gone. The quiet volume is a sign that many have given up on $SEA, so the correction may be coming to an end.
We are placing $SEA on today’s watchlist. Trade details can be found above.
First Trust ISE Revere Natural Gas ($FCG) has been in base mode since the last rally stalled in late October at $20.50. After breaking down below the 50d-day MA in early December, $FCG made a run at the prior swing low from November 7 on Wednesday. The intraday selloff was quickly reversed, producing a bullish reversal candle by Wednesday’s close (the close was back above the the last swing low).
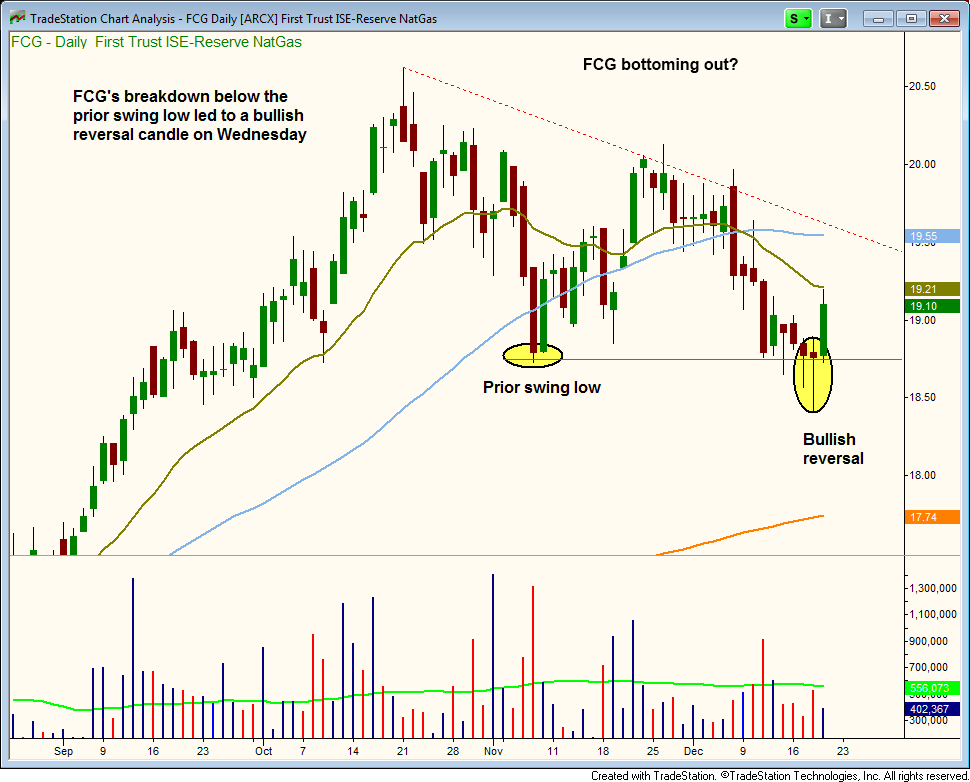
On Thursday, $FCG followed through on the prior day’s bullish reversal action with a decent rally that stopped just shy of the 20-day EMA. We are placing $FCG on today’s watchlist with two potential entry points (see trade details above).
On the stock side, $SCTY buy entry triggered and put in an explosive accumulation day. We will look to add to the position once the action settles down.
$OTIV triggered on the open. $WDAY did not trigger, as it failed to clear the 5-minute high + 10 cents. Note the new entry price above.
We placed $IRBT on today’s watchlist, as it is pulling back to the 50-day MA after an explosive reaction to earnings. We are adding a 1/3 position at the 50-day MA, looking for the gap up and 200-day MA to provide support.
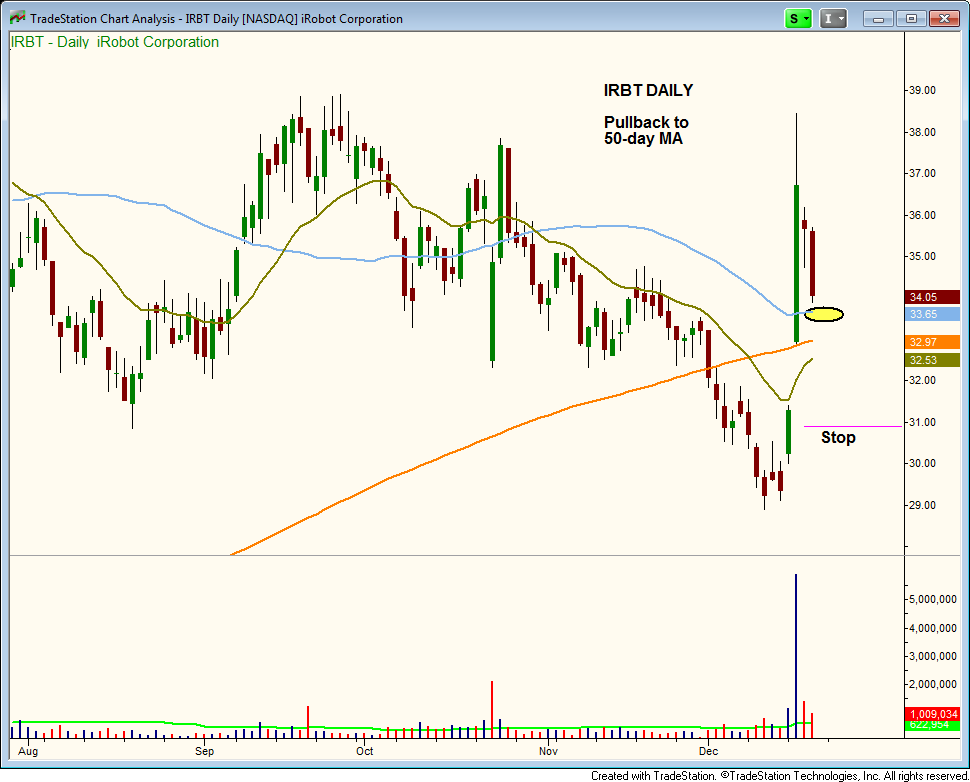
We will have to be patient with this setup as the action is still volatile. However, $IRBT has a great monthly chart, as a breakout above the current range high will also be a breakout to new all-time highs.