Current signal generated on close of July 11.
Portfolio exposure should at least be 75% to 100% long or more (if you can go on margin).
Past signals:
- Neutral signal generated on close of July 5
- Sell signal generated on close of June 24
today’s watchlist (potential trade entries):

Having trouble seeing the open positions graphic above? Click here to view it directly on your web browser instead.
open positions:
Below is an overview of all open positions, as well as a report on all positions that were closed only since the previous day’s newsletter. Changes to open positions since the previous report are listed in pink shaded cells below. Be sure to read the Wagner Daily subscriber guide for important, automatic rules on trade entries and exits. Click here to learn the best way to calculate your share size.

Having trouble seeing the open positions graphic above? Click here to view it directly on your web browser instead.
closed positions:
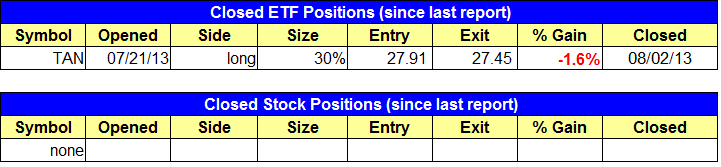
Having trouble seeing the closed positions graphic above? Click here to view it directly on your web browser instead.
ETF position notes:
- $TAN sell stop triggered for the shares we recently added.
stock position notes:
- Note the new stops above.
ETF, stock, and broad market commentary:
In the August 1 issue of The Wagner Daily, we pointed out that the S&P 500 and Nasdaq Composite were at pivotal levels of resistance and that their ability or inability to break out to new highs would determine the direction of the broad market’s next major move. That same day, all the main stock market indexes convincingly broke out to fresh highs. Stocks built on momentum of that breakout last Friday, as both the S&P and Dow rose 0.2% and the Nasdaq Composite gained another 0.4%. Volume in both exchanges was lighter, but markets can easily rise on lighter volume when there is a complete lack of overhead resistance levels.
For the past FIVE YEARS, iShares Goldman Sachs Natural Resources Index Fund ETF ($IGE) has been forming a pennant-like pattern that is only apparent on its long-term monthly chart:

Since the beginning of this year, the trading range of $IGE has tightened up significantly and it now appears as though an actionable buy entry into this ETF may soon occur. Drilling down to the weekly time frame, notice that $IGE is poised to imminently break out above horizontal price resistance:

If $IGE breaks out above resistance, we will buy partial share size as a new swing trade entry. Please note our exact trigger, stop, and target prices on the “watchlist” section of today’s newsletter.
Even if $IGE rallies above horizontal price resistance, upper channel resistance of its 5-year downtrend line (shown on the first chart) is still about another point overhead. This is why we are only targeting this trade with partial share size on the initial entry. However, if $IGE forms a strong weekly closing bar on higher volume, we would likely add to the position at that point.
We still hold the original position of $TAN with a 13% share price gain from our July 2 entry, but we stopped out of the added shares last Friday. We wanted to maintain a very tight stop on the added shares, so the share price loss was only 1.5%.
With the stock market breaking out to new highs over the past two days, one might understandably assume it is negative that $TAN has not moved higher alongside of the market. However, we’re not overly concerned because the problem is simply that the solar stocks rallied AHEAD OF the broad market, so now they are taking a break (consolidating). Solar stocks are simply out of sync with the broad market, BUT we will continue to hold because the uptrend of $TAN remains intact (price is above the 20, 50, and 200-day moving averages and all are sloping higher).
We have two new buy setups on today’s watchlist in $HIMX and $BERY. Neither setup is A rated, meaning that if your portfolio is full there is no reason to cut what you own to move into these names. However, just because a stock is not A rated doesn’t mean that it can’t outperform. An A rated stock (for us) is one with top earnings, volume, and price action. If a stock is slightly off in any of those areas it is not A rated. An example of an A rated stock is $LNKD or $KORS.
Himax Technologies ($HIMX) is forming the handle portion of a cup and handle pattern. The depth measured from the high of the left side of the cup to the low of the cup is over 40%, and that is a bit wide. However, $HIMX is only a $7 stock which is basing out after a +100% move, so a little extra volatility is to be expected. The same can be said for the handle, which in a normal cup and handle pattern should not be more than 15% wide, but $HIMX is at 19%. Again, this is fine, as it is a volatile stock (if GOOG had a 20% handle that would be ugly). Since earnings are due on Aug. 15, we are taking a very small position to see if we can get a pop ahead of earnings. The stop is tight, so it is a G.O.N.G situation…(go or no go).

Note: You can download the RS+EPS Combo list by logging into the members section of our website.