Commentary:
Since the strong gap up on November 4th, the major averages have been consolidating in a narrow trading range. In today’s action, the markets opened with mild selling pressure, caught a bid at the 11:00 am reversal period and meandered for the remainder of the session. Trading was choppy, volume was down and there was no sign of market leadership. The Nasdaq and the small-cap Russell 2000 indices ended the day flat. The S&P MidCap 400, S&P 500 and the Dow Jones Industrial average dropped 0.1%, 0.2% and 0.3% respectively. Monday’s session can be characterized as uneventful. However, given the big gap day last Thursday, it is not surprising that the major averages spent a second day consolidating
For the second straight trading day volume fell significantly on both the NYSE and the Nasdaq. In Monday’s trading, turnover on the Nasdaq fell by 14%. Volume on the NYSE plummeted a dramatic 28%. On both indices, the advancing volume to declining volume ratio was almost at par. On the NYSE down volume edged out up volume by a factor of 1.2 to 1. The Nasdaq saw advancing volume slightly outpace declining volume by a ratio of 1.1 to 1. Although the internals reflected a lack of leadership on Monday, the multi-day consolidation suggests the market is preparing for another advance.
Since our buy entry this past Friday, IDX broke through resistance on very strong volume today. IDX also showed excellent relative strength to the broad market, as it closed near the highs of the day. For our regular subscribers, the trade details are posted in the daily performance section of the newsletter.
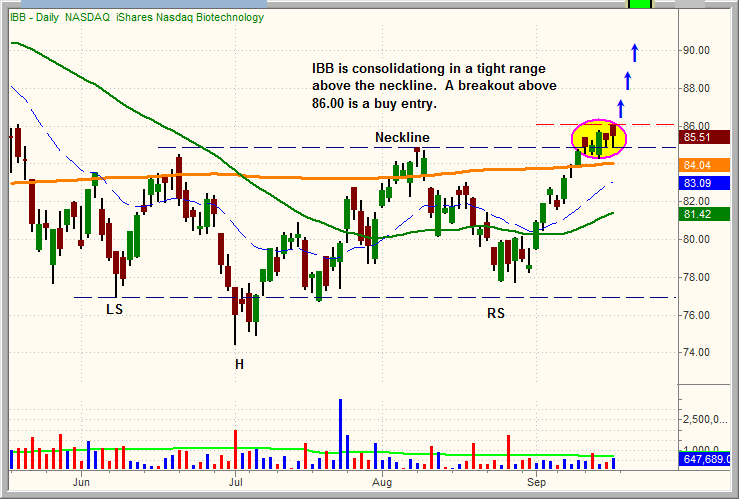
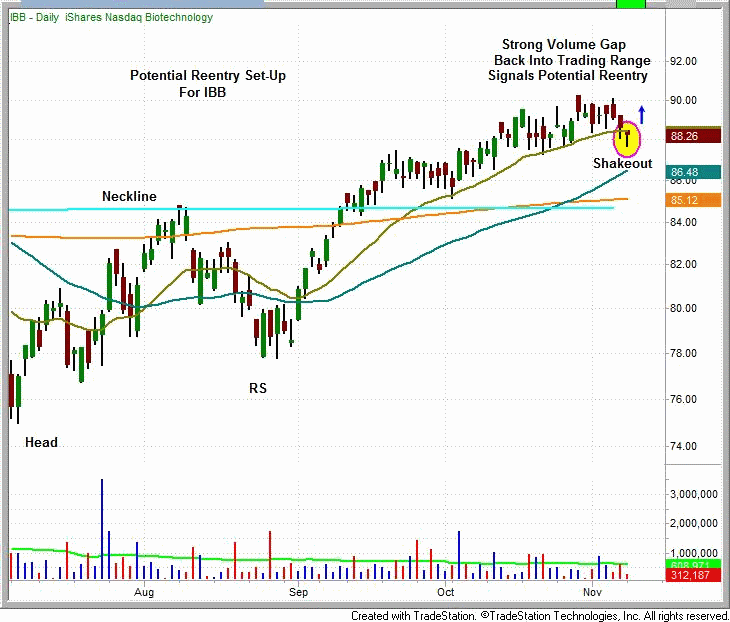
In the September 20th newsletter we placed the iShares Nasdaq Biotechnology Index Fund (IBB) on the watchlist (see chart below). Our buy trigger was met and we entered the trade. As IBB rallied, we tightened our stop because we weren’t comfortable with the price action. Despite the fact that we had not yet reached our projected target, the price action compelled us to protect our gains. On November 1st, IBB hit the stop and we realized a healthy 2.75 point profit. On Monday IBB undercut the 20-day EMA, and traded as low as $87.71. This was the first breach of this moving average since IBB began rallying on September 1st. This drop below the 20-day EMA may provide the opportunity to reenter this trade. The setup that we are looking for is a gap-up back above the 20-day EMA. A gap-up immediately following a sweep below the moving average generally signals the continuation of the trend. The stops get swept and the gap-up creates a short squeeze. Further, once the neckline of an inverse head and shoulders pattern is broken, it is quite common for an ETF to pull back into or near the neckline (As IBB has done). The former resistance is now support.


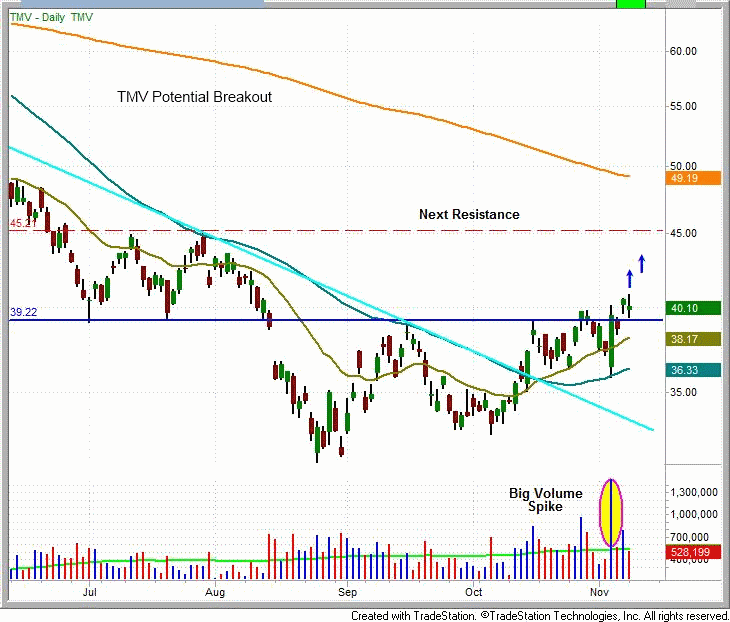
The Direxion Daily 30-Yr Treasury Bear 3X Shrs (TMV), reversed the downtrend when it closed above the trend line on October 14th. On November 3rd this ETF saw a big burst of volume, undercut the 20-day MA, bounced off the 50-day MA and then rallied to close at the highs of the day. That’s an impressive move. A volume fueled rally back above Monday’s high, presents a potential buy entry for this ETF. Since TMV is highly leveraged, position size must be adjusted accordingly. Further, TMV is not intended to be held for more than a few days because of daily resets. Always use caution when trading highly leveraged ETFs.

There are many ETFs exhibiting bullish strength. But, our strategy is to find technical patterns that provide definable risk to reward ratios. With only three days of consolidation since a major rally, we are cautious about chasing the market. Quality technical patterns yield quality trades.
Today’s Watchlist:
There are no new official setups for today. We will send an Intraday Alert if any new trades are made.
Daily Performance Report:
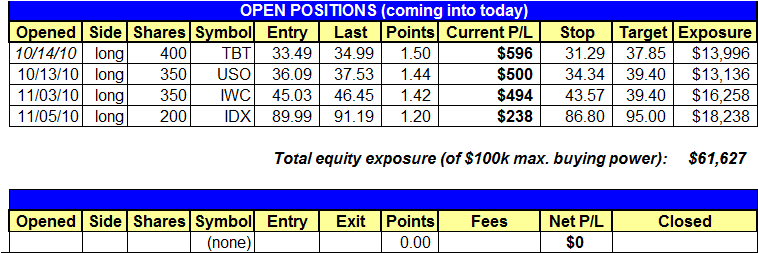
Below is an overview of all open positions, as well as a performance report on all positions that were closed only since the previous day’s newsletter. Net P/L figures are based on the $50,000 Wagner Daily model account size. Changes to open positions since the previous report are listed in red text below. Please review the Wagner Daily Subscriber Guide for important, automatic rules on trigger and stop prices
No changes to our open positions today.
- Reminder to subscribers – Intraday Trade Alerts to your e-mail and/or mobile phone are normally only sent to indicate a CHANGE to the pre-market plan that is detailed in each morning’s Wagner Daily. We sometimes send a courtesy alert just to confirm action that was already detailed in the pre-market newsletter, but this is not always the case. If no alert is received to the contrary, one should always assume we’re honoring all stops and trigger prices listed in each morning’s Wagner Daily. But whenever CHANGES to the pre-market stops or trigger prices are necessary, alerts are sent on an AS-NEEDED basis. Just a reminder of the purpose of Intraday Trade Alerts.
- For those of you whose ISPs occasionally deliver your e-mail with a delay, make sure you’re signed up to receive our free text message alerts sent to your mobile phone. This provides a great way to have redundancy on all Intraday Trade Alerts. Send your request to [email protected] if not already set up for this value-added feature we provide to subscribers.

Having trouble seeing the position summary graphic above?
Click here to view it directly on your Internet browser instead.
Notes:
Edited by Deron Wagner,
MTG Founder and
Head Trader