Commentary:
Stocks pushed moderately higher during the morning session before running out of gas around noon. That was pretty much all she wrote for the day’s gains, as the broad market averages chopped around in a tight range for the next few hours. The afternoon stalling action finally gave way to a sharp selloff in the Nasdaq Composite and S&P 500 during the final hour of trading, which clearly disappointed those expecting the morning momentum to follow through to the upside. The S&P MidCap 400 held up best into the close, finishing with a gain of 0.6%. The small-cap Russell 2000 and Nasdaq Composite posted near identical gains of 0.3% and 0.2% respectively. The S&P 500 closed the session flat, while the Dow Jones Industrial Average slipped into negative territory at -0.1%.
Total volume dropped considerably off the prior day’s pace on both exchanges. NYSE volume sank 27%, while Nasdaq volume slowed by 18%. Even if the broad market averages continued to rally in the afternoon, in order to log a bullish accumulation day they would have been hard pressed to beat Tuesday’s strong spike in volume. Market internals were fairly weak throughout the session. The morning advance produced very ordinary up/down volume readings of 1.7 to 1 on the NYSE and 2.6 to 1 on the Nasdaq. The NYSE and Nasdaq a/d volume ratios dropped to parity by the close.
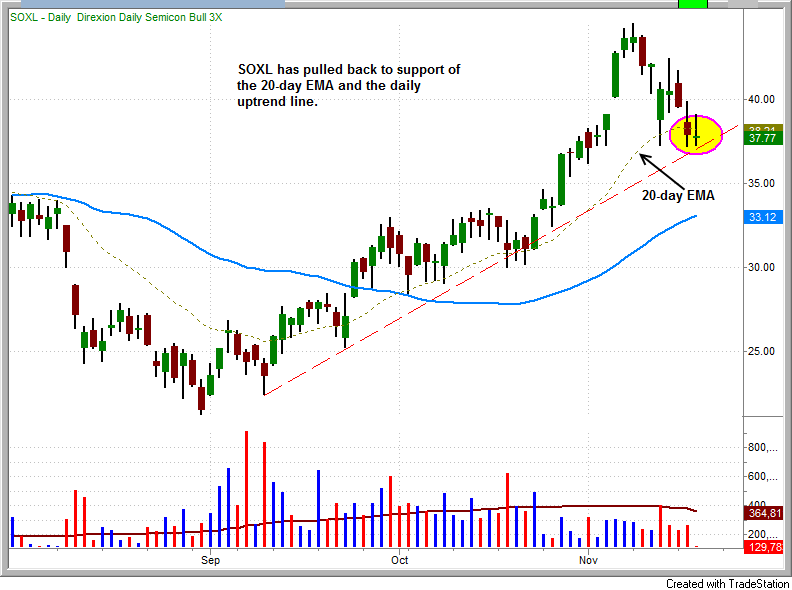
Direxion Daily Semiconductor Bull 3x (SOXL) is setting up for a potential pullback entry as it attempts to find support around the 20-day EMA and the daily uptrend line. Ideally, we would like to see a one bar shakeout that undercuts the $37.00 level before the price action reverses higher.
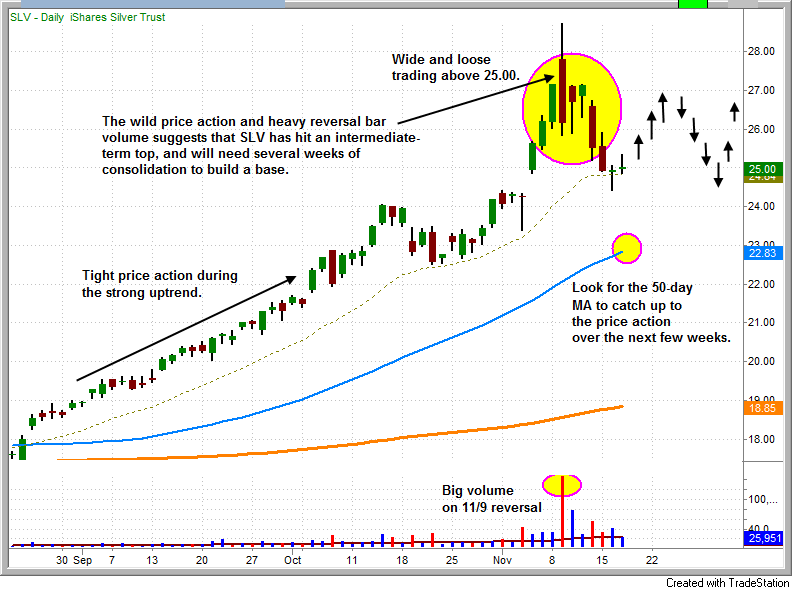
The monster buying frenzy in iShares Silver (SLV) looks to have hit a brick wall in early November. The late to the party buyers above 25.00 were treated to a nasty, big volume reversal bar on 11/9 and are now sitting about 15% off the recent swing high. The wild and loose price action suggests that SLV will need several weeks of base building before it can stage another intermediate-term advance. The chart below shows the possible projected choppy price action if SLV forms a constructive base.
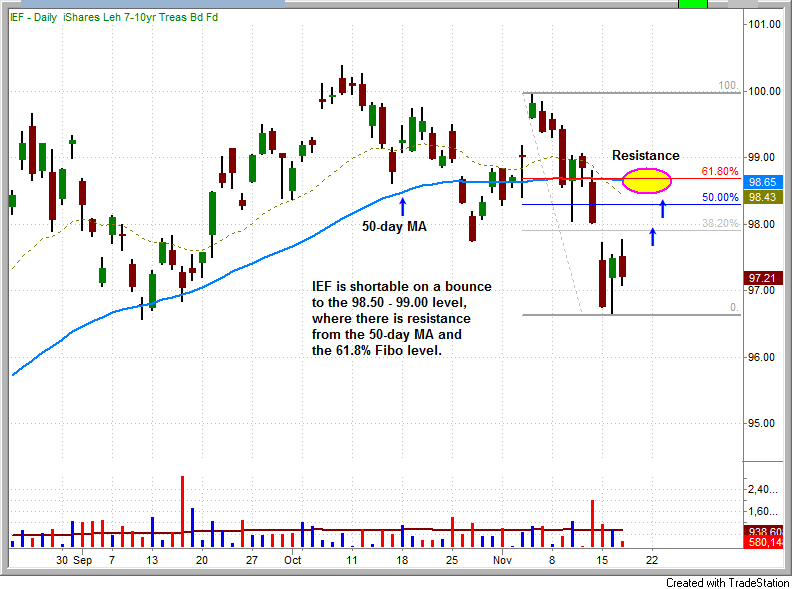
We were able to take advantage of the ugly selloff in bonds through TBT, which we sold this week for a 13% gain on the trade (a 3.5% gain in our model portfolio). The iShares 7-10 Year Treasury Bond Fund (IEF) is shortable on a bounce into the 50-day moving average (around the 98.50 – 99.00 level), which coincides with the 61.8% Fibo level (measured from the 11/4 high to the 11/16 low). Any rally that stalls out below the 11/4 high and subsequently breaks the 11/16 low will produce the first lower high and lower low, which represents a potential reversal in trend.
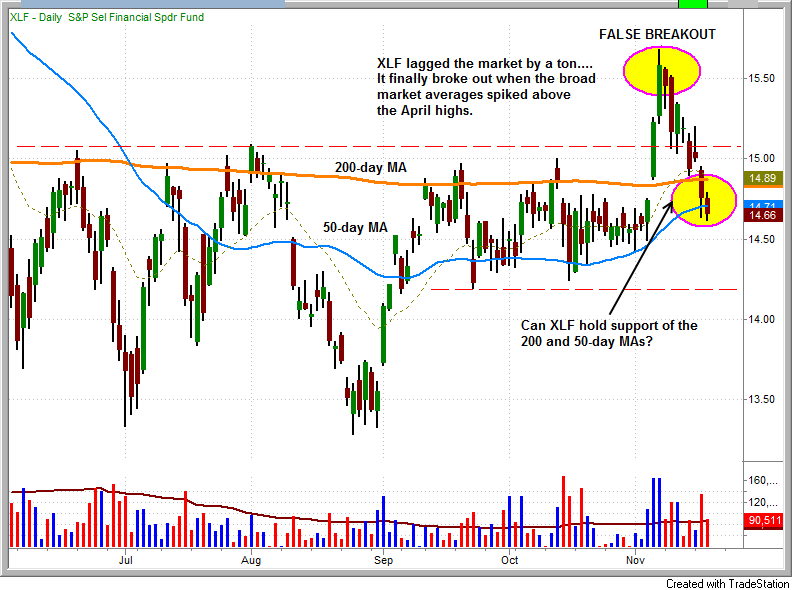
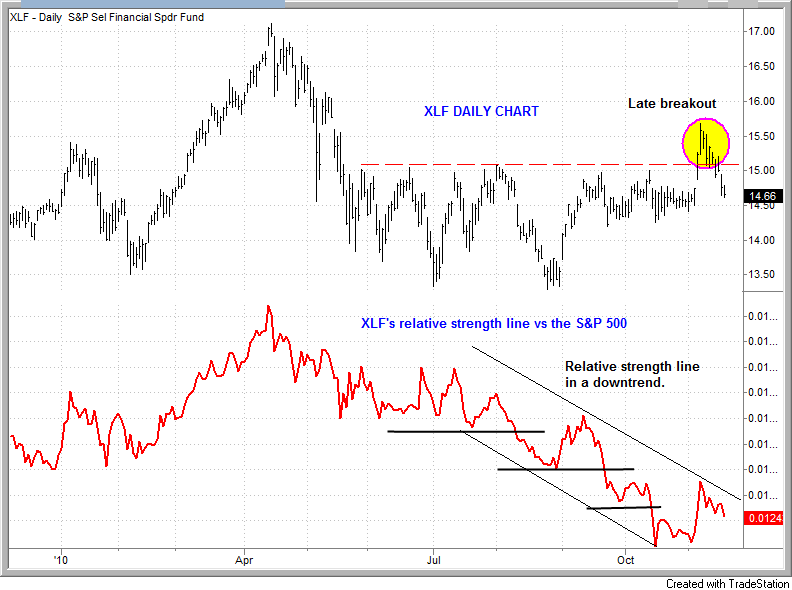
The late to the party breakout in the SPDRs Select Sector Financial (XLF) was probably fueled by a few days of short covering, as there was no demand for the ETF once the initial surge above the highs of the obvious range stalled out. The false breakout action quickly reversed back below the 200-day and 50-day MAs. While we are certainly not looking for XLF to provide market leadership, we’d like to see the price action hold above 14.00.
We plotted the relative strength line below the daily chart of XLF to show the lagging performance of XLF vs. the S&P 500. Notice how the relative strength line has been in a downtrend during the entire consolidation phase. There is no reason we can think of to attempt to buy a late breakout in XLF. New traders often get caught up in the temptation of buying a laggard stock or ETF in hopes that the price will play catch up with the rest of the market. The majority of the best movers during a rally breakout when the broad market bottoms or within a few weeks of the bottom.
Given the lack of follow through from the morning session, its still difficult to determine whether or not the market is trying to form a short-term bottom. Despite the broad market trend, recent heavy distribution, lack of quality leadership, and no clear signal that a bottom is being set, it is our stance to be patient and wait for clear setups to develop.
Today’s Watchlist:
There are no new official setups this morning. We will send an Intraday Alert if anything catches our eye while trading.
Daily Performance Report:
Below is an overview of all open positions, as well as a performance report on all positions that were closed only since the previous day’s newsletter. Net P/L figures are based on the $50,000 Wagner Daily model account size. Changes to open positions since the previous report are listed in red text below. Please review the Wagner Daily Subscriber Guide for important, automatic rules on trigger and stop prices
No changes to open positions at this time.
- Reminder to subscribers – Intraday Trade Alerts to your e-mail and/or mobile phone are normally only sent to indicate a CHANGE to the pre-market plan that is detailed in each morning’s Wagner Daily. We sometimes send a courtesy alert just to confirm action that was already detailed in the pre-market newsletter, but this is not always the case. If no alert is received to the contrary, one should always assume we’re honoring all stops and trigger prices listed in each morning’s Wagner Daily. But whenever CHANGES to the pre-market stops or trigger prices are necessary, alerts are sent on an AS-NEEDED basis. Just a reminder of the purpose of Intraday Trade Alerts.
- For those of you whose ISPs occasionally deliver your e-mail with a delay, make sure you’re signed up to receive our free text message alerts sent to your mobile phone. This provides a great way to have redundancy on all Intraday Trade Alerts. Send your request to [email protected] if not already set up for this value-added feature we provide to subscribers.

Having trouble seeing the position summary graphic above?
Click here to view it directly on your Internet browser instead.
Notes:
Edited by Deron Wagner,
MTG Founder and
Head Trader