Buy
– Signal generated on the close of April 30 (click here for more details)
today’s watchlist (potential trade entries):

Having trouble seeing the open positions graphic above? Click here to view it directly on your web browser instead.
open positions:
Below is an overview of all open positions, as well as a report on all positions that were closed only since the previous day’s newsletter. Net P/L figures are based a $100,000 model portfolio. Changes to open positions since the previous report are listed in pink shaded cells below. Be sure to read the Wagner Daily subscriber guide for important, automatic rules on trade entries and exits.

Having trouble seeing the open positions graphic above? Click here to view it directly on your web browser instead.
closed positions:

Having trouble seeing the closed positions graphic above? Click here to view it directly on your web browser instead.
ETF position notes:
- $SMH triggered our stop, locking in an $1,100 gain or 9% move.
stock position notes:
- No trades were made.
ETF, stock, and broad market commentary:
Tuesday’s action lacked any punch, with all major averages chopping around on light volume and closing in the +0.1% to -0.2% range. Although we would welcome a short-term pullback in the market, we know that a strong rally can hold above the 10-day moving average for several weeks (see S&P 500 price action in January of this year).
$SMH hit our protective stop and we are out with an $1,100 gain on a 9% move. $SMH finally reversed on the hourly chart yesterday, breaking the 20-period EMA and the steep uptrend line. The next stop for $SMH could be the 10-day moving average, around $38.
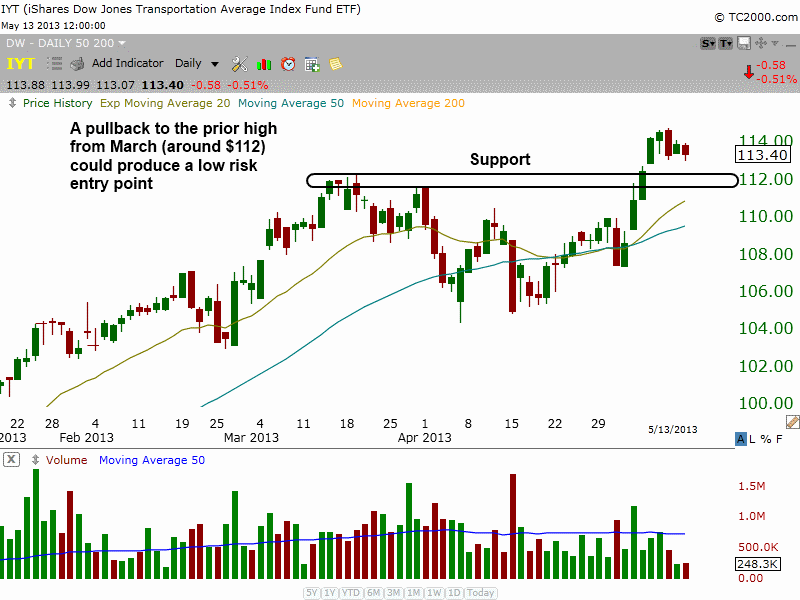
iShares Dow Jones Transportation Average ($IYT) recently broke out from a bullish, six-week base at the highs. It is a bit too extended to purchase now, but a pull back to the prior breakout level around $112 could present us with a low-risk pullback entry.

The base leading up to the breakout is strong, with a tight consolidation at the highs and the 20-day EMA above the 50-day MA, and the 50-day above the 200-day MA.
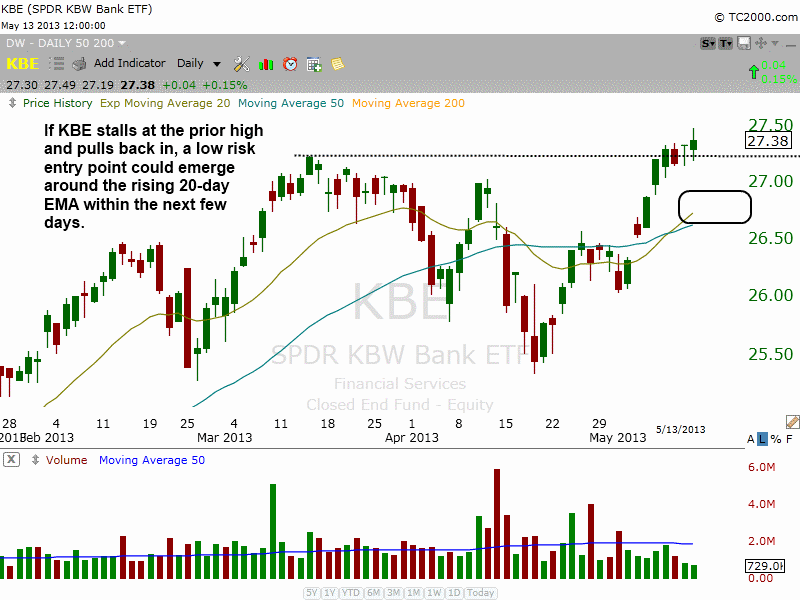
SPDR KBW Bank ETF ($KBE) looks a lot like $IYT with the tight basing action at the highs, but the current breakout attempt has failed to extend much beyond the prior high. A failed breakout attempt could lead to a pullback to the rising 20-day EMA around $27, which would also coincide with a pullback to the downtrend line that connects from the high of 3/14 to the high of 4/11. The 50-day MA would also provide support, as it is currently sitting at 26.62.

Like $IYT, the 20-day EMA has crossed above the 50-day MA, and the 50-day MA is well above the 200-day MA and all averages are trending higher.
On the stock side, $AMBA rallied to the prior highs at $16 before pulling back in the afternoon. The price action looks bullish on the hourly chart and $AMBA could easily move to new highs this week. $P closed near the low of the day after a strong first hour of trading. There is no point in raising our stop yet, as our stop is just below the most recent swing low, which is where it needs to be to give the setup room to breathe.
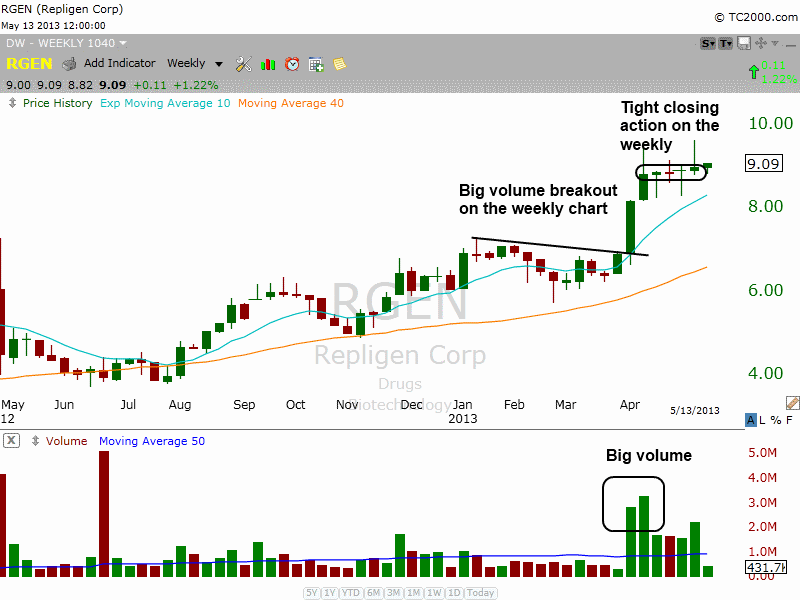
We have one new setup on today’s watchlist in RGEN, which is a small cap biotech stock. After a strong volume breakout on the weekly chart, $RGEN has formed a tight base above $8 the past five weeks.

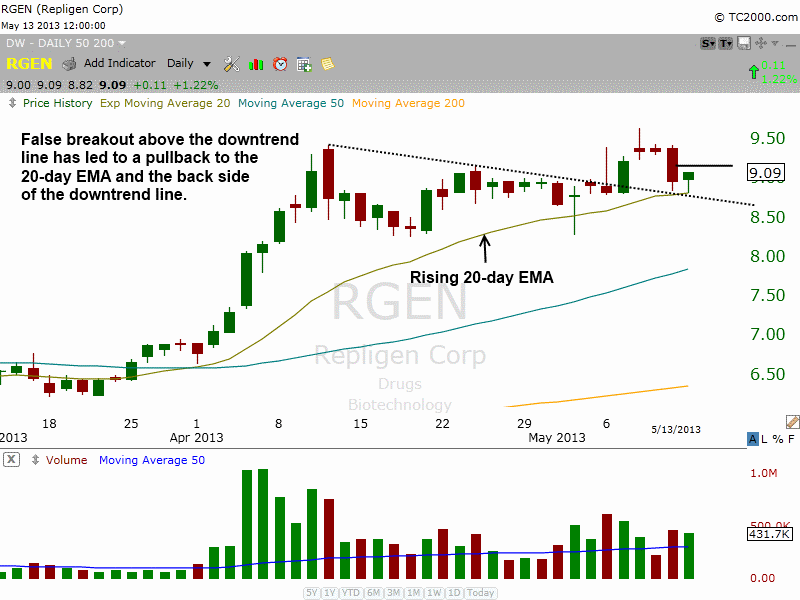
The daily chart shows the recent false breakout above the highs of the base and the downtrend line. Our buy entry is over Monday’s high, with a pretty tight stop below the 20-day EMA. We are looking for an explosive 20-25% move over 3 to 10 days if/when the setup triggers.

We are only risking about 1/4 of our max size on this trade, which is about half the size of trades we have been taking the past few weeks. Trades like $RGEN can generate income for our portfolio while we patiently wait for other positions to get going.
relative strength combo watchlist:
Our Relative Strength Combo Watchlist makes it easy for subscribers to import data into their own scanning software, such as Tradestation, Interactive Brokers, and TC2000. This list is comprised of the strongest stocks (technically and fundamentally) in the market over the past six to 12 months. The scan is updated every Sunday, and this week’s RS Combo Watchlist can be downloaded by logging in to the Members Area of our web site.