Commentary:
Tuesday’s price and volume action left a bearish aftertaste in what began as a bullish feast. The major indices gapped up sharply at the open, but quickly reversed and took back most of the opening move in the morning session. At 12:30 buyers stepped in and it appeared that the gap might hold. But at the 2:30 reversal period the bears took control as volume spiked. Despite the heavy afternoon selling, four of the five major indices managed to close flat, with the small-cap Russell 2000 being the only index to post a noteworthy gain. It is important to note that yesterday’s massive volume on the NYSE was, in large part, the result of over 2 billion shares trading hands in Citibank.
Because of the wild activity in Citibank, it is difficult to make a clear assessment of the market internals. Turnover on Tuesday was massive on the NYSE. Day over day the volume traded on this index rose by an astonishing 70%. Nasdaq volume was also heavy, as it climbed by an impressive 19% on Tuesday. Because of the overwhelming volume in Citibank, we are inclined to analyze the broad market through the eyes of the Nasdaq. And, for the most part, the Nasdaq performed poorly. In yesterday’s session, the advancing volume to declining volume ratio ended at breakeven on the Nasdaq, while up volume outpaced down volume by a factor of 1.6 to 1 on the NYSE.
As a rule, we generally avoid the news. When an anomaly occurs we will investigate in order to better assess the situation. But, at the end of the day, we make our decisions based upon our time tested technical trading philosophy. As such, other than natural human curiosity to find out where the volume spike originated, we have no interest in attempting to analyze the rationale behind or implications of the event via the mass media. In the midst of such dramatic events we rely on the charts. That’s why we are technical traders. The charts tell us what we need to know.
So what did the charts tell us yesterday? They told us that bears controlled the entire day’s price action subsequent to the opening gap. Depending on the index, what we witnessed was a false breakout and a return to support (Nasdaq and S&P 500) or the trading range (DJIA). Below are charts of the Dow, the SPY and the Nasdaq. Without the need of headlines or esoteric rhetoric, these simple pictures speak a thousand words.
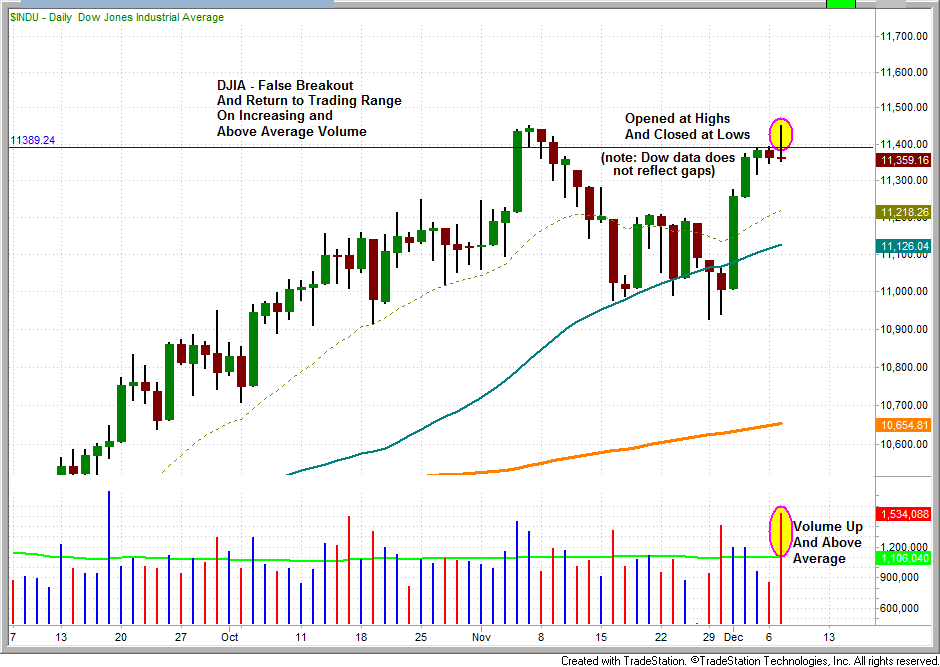
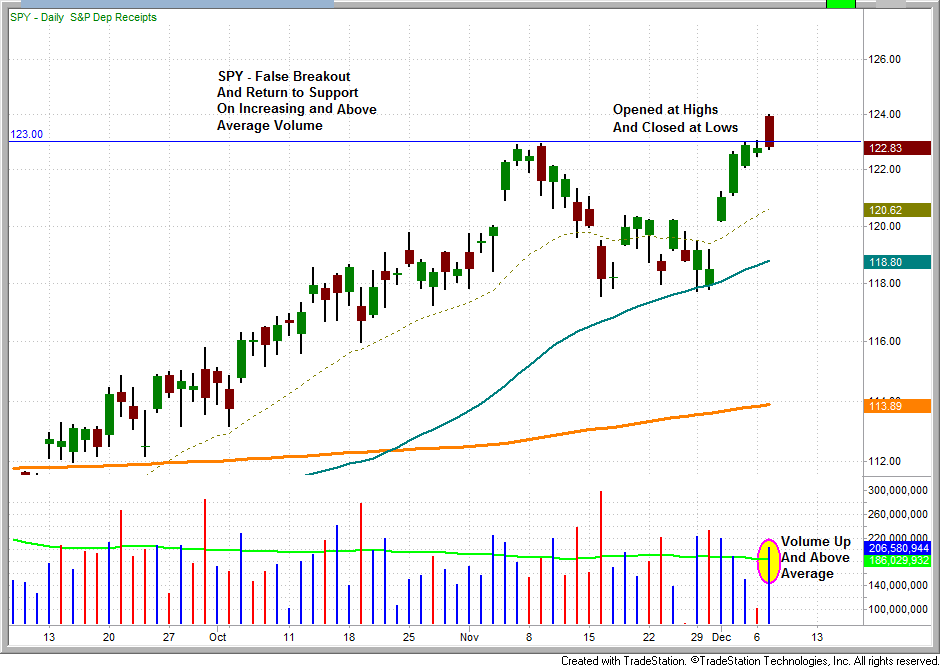
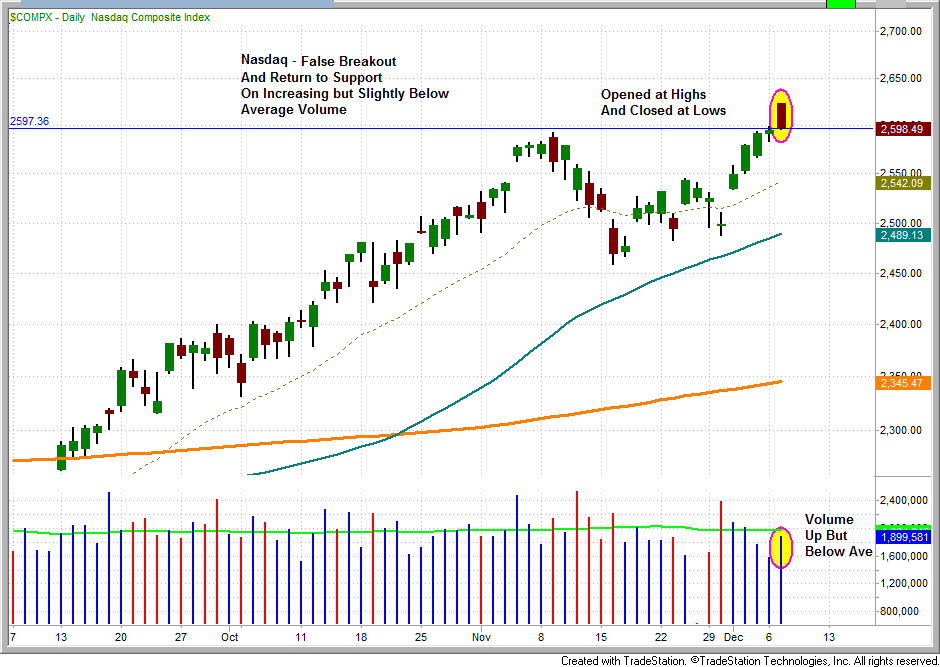
Ultimately, markets do whatever they do, news sources report whatever they report, and experts have whatever opinions they have. There’s never a shortage of explanations about movements in the market. But, we have rules that govern our trading, which we can choose to follow or choose to ignore. We cannot control the market, the news or other’s opinions, but we can control our own trading behavior.
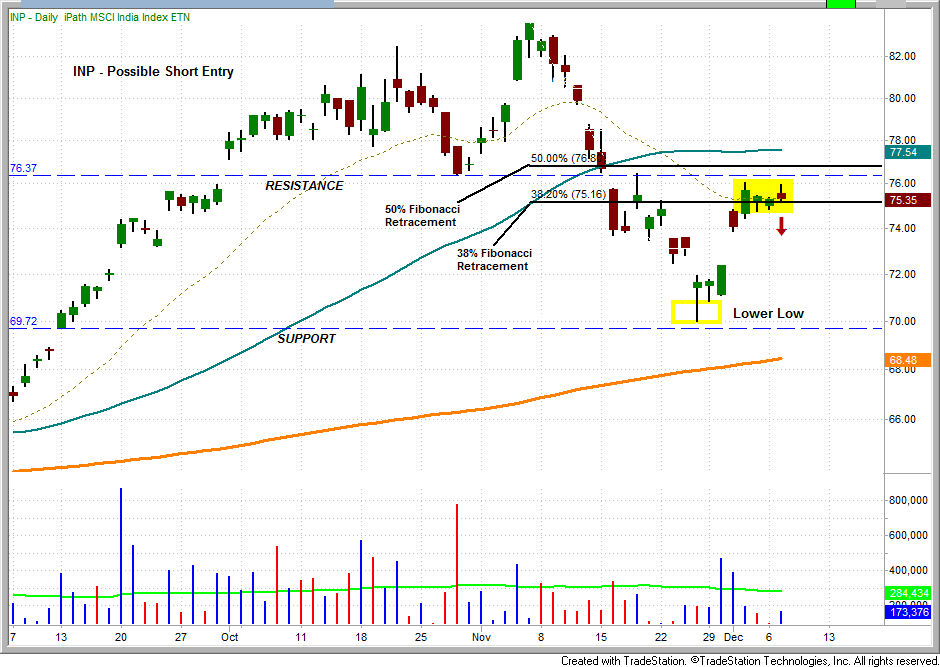
The iPath India Index ETN (INP), has rallied back into resistance after bouncing off a long term support level on November 26th. This date also marks the first “lower-low” set by INP since 2009. This suggests that INP could be in the midst of a trend reversal or possibly range bound. Over a several year time frame INP still exhibits strength, but over the past several weeks it has significantly underperformed the market and broke below a key support level ($76.30). If the market corrects here, INP could once again test the $70.00 mark. A drop below the December 3rd low of $74.80 provides a possible short trigger for INP.
Should the market follow through on yesterday’s bearish reversal, we are likely to tighten our stops in those positions exhibiting relative weakness. When faced with volatile market conditions it is wise to proactively re-evaluate trades and adjust stops accordingly.
Today’s Watchlist:
There are no new official setups this morning. We will send an intraday alert if any new trades are made.
Daily Performance Report:
Below is an overview of all open positions, as well as a performance report on all positions that were closed only since the previous day’s newsletter. Net P/L figures are based on the $50,000 Wagner Daily model account size. Changes to open positions since the previous report are listed in red text below. Please review the Wagner Daily Subscriber Guide for important, automatic rules on trigger and stop prices
No changes to our open positions at this time.
- Reminder to subscribers – Intraday Trade Alerts to your e-mail and/or mobile phone are normally only sent to indicate a CHANGE to the pre-market plan that is detailed in each morning’s Wagner Daily. We sometimes send a courtesy alert just to confirm action that was already detailed in the pre-market newsletter, but this is not always the case. If no alert is received to the contrary, one should always assume we’re honoring all stops and trigger prices listed in each morning’s Wagner Daily. But whenever CHANGES to the pre-market stops or trigger prices are necessary, alerts are sent on an AS-NEEDED basis. Just a reminder of the purpose of Intraday Trade Alerts.
- For those of you whose ISPs occasionally deliver your e-mail with a delay, make sure you’re signed up to receive our free text message alerts sent to your mobile phone. This provides a great way to have redundancy on all Intraday Trade Alerts. Send your request to [email protected] if not already set up for this value-added feature we provide to subscribers.
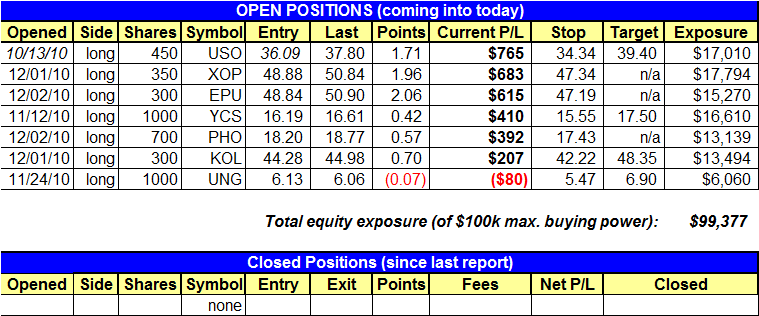
Having trouble seeing the position summary graphic above?
Click here to view it directly on your Internet browser instead.
Notes:
Edited by Deron Wagner,
MTG Founder and
Head Trader