Current signal generated on close of September 9.
Portfolio long exposure can be anywhere from 30%-50% if you just joined the letter, or up to 100% (if your stocks are holding up).
Past signals:
- Neutral signal generated on close of August 15
- Buy signal generated on close of July 11
- Neutral signal generated on close of July 5
- Sell signal generated on close of June 24
today’s watchlist (potential trade entries):

Having trouble seeing the open positions graphic above? Click here to view it directly on your web browser instead.
open positions:
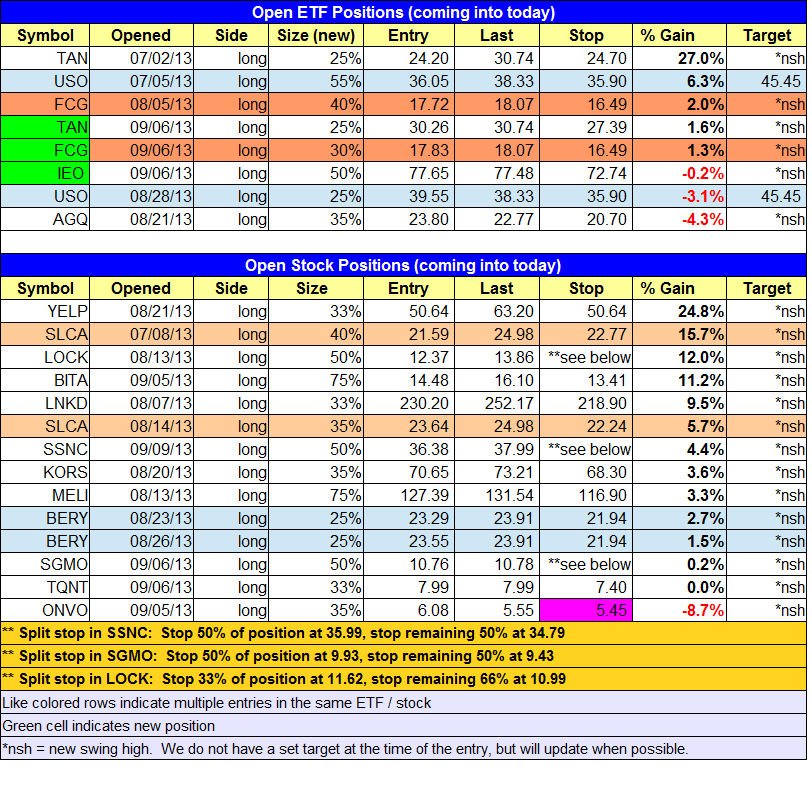
Below is an overview of all open positions, as well as a report on all positions that were closed only since the previous day’s newsletter. Changes to open positions since the previous report are listed in pink shaded cells below. Be sure to read the Wagner Daily subscriber guide for important, automatic rules on trade entries and exits. Click here to learn the best way to calculate your share size.

Having trouble seeing the open positions graphic above? Click here to view it directly on your web browser instead.
closed positions:

Having trouble seeing the closed positions graphic above? Click here to view it directly on your web browser instead.
ETF position notes:
- No trades were made.
stock position notes:
- No trades were made.
ETF, stock, and broad market commentary:
Stocks posted solid gains on Tuesday, with the major averages closing up in the 0.6% to 1.0% range on heavier trade. Although the S&P 500 is back above the 50-day MA, there is still quite a bit of overhead resistance in the 1,685 to 1,695 area, so we anticipate some sort of pause or short-term pullback developing within the next few days.
For the second day in a row, we do not have any new trade setups, as most of our A or B rated setups are a bit extended at current levels and need to pull back in. We already have a decent amount of long exposure, so we can afford to be patient and wait for high quality setups to emerge.
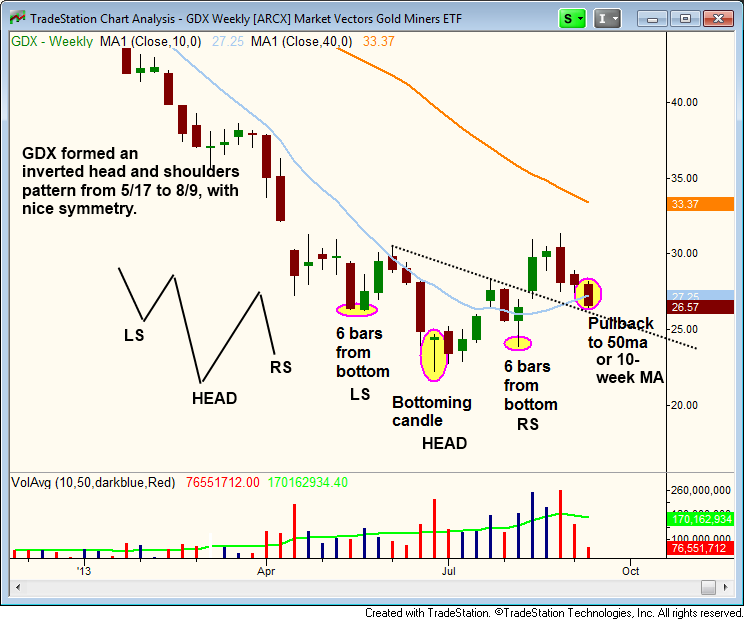
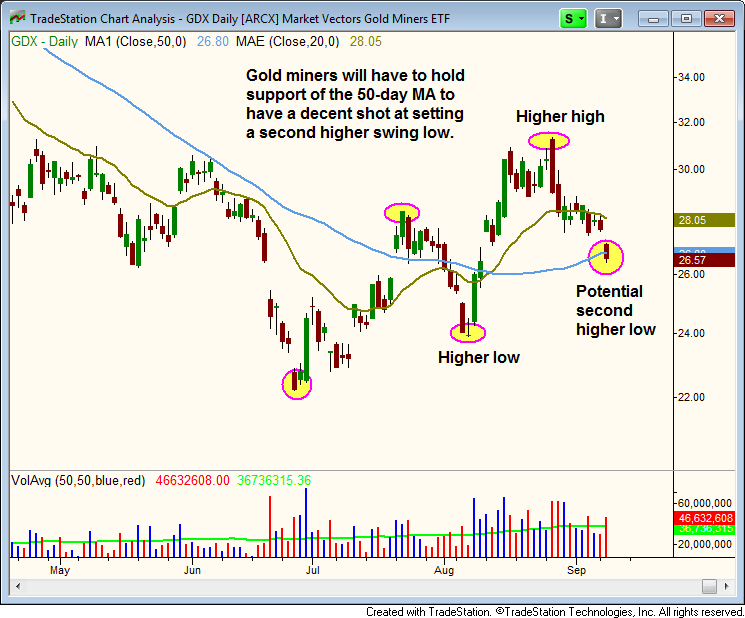
After an ugly nine month long selloff in Market Vectors Gold Miners ($GDX), there is a potential reversal of trend in place with a higher low and higher high printing in July and August, along with an inverted head and shoulders pattern that formed from 5/17 to 8/9. The pattern did have nice symmetry, with six candles separating the left and right shoulders from the center or head.

$GDX should hold up around the 50-day MA to have a decent shot of setting another higher swing low. A second higher swing low, followed by another swing high would confirm that a significant trend reversal is underway.

As mentioned above, we continue to lay low with regard to new setups the past two days. $VNDA remains on the watchlist. We lowered the stop in $ONVO by a few pennies. If the stop in $ONVO is taken out early and the price action quickly recovers, then look to unofficially re-enter above 5.81 with a stop beneath Wednesday low.
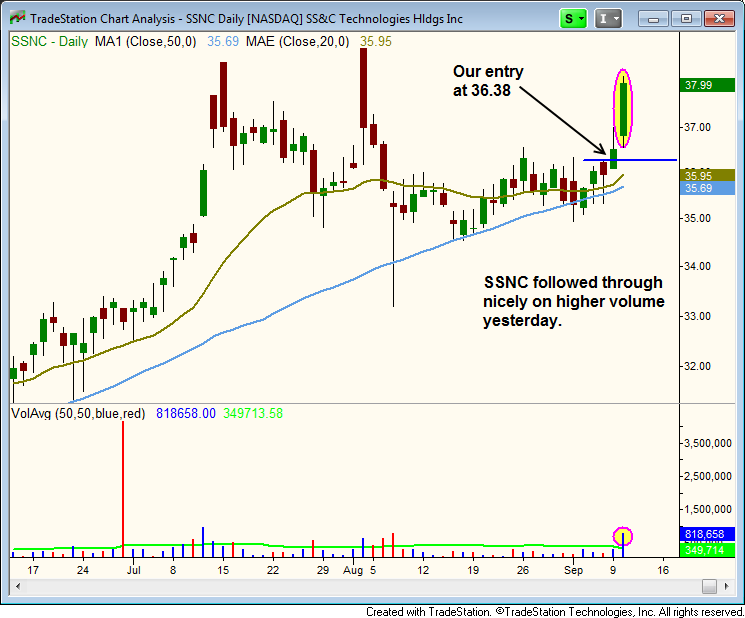
$SSNC ripped higher on Tuesday, following through on the previous day’s breakout above the swing high of 8/2 (Note the strong pick up in volume during Tuesday’s rally). We look for $SSNC to test the recent highs and pull back in for a few days or weeks. If a secondary entry point develops, then we will look to add to our position.
