Current signal generated on close of July 11.
Portfolio exposure should at least be 75% to 100% long or more (if you can go on margin).
Past signals:
- Neutral signal generated on close of July 5
- Sell signal generated on close of June 24
today’s watchlist (potential trade entries):

Having trouble seeing the open positions graphic above? Click here to view it directly on your web browser instead.
open positions:
Below is an overview of all open positions, as well as a report on all positions that were closed only since the previous day’s newsletter. Changes to open positions since the previous report are listed in pink shaded cells below. Be sure to read the Wagner Daily subscriber guide for important, automatic rules on trade entries and exits. Click here to learn the best way to calculate your share size.

Having trouble seeing the open positions graphic above? Click here to view it directly on your web browser instead.
closed positions:
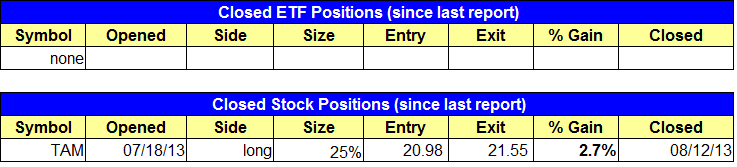
Having trouble seeing the closed positions graphic above? Click here to view it directly on your web browser instead.
ETF position notes:
- $YINN buy setup was automatically canceled as it gapped above our entry by more than 1.3% on the open.
stock position notes:
- Sold $TAM on the open ahead of earnings for a small gain.
ETF, stock, and broad market commentary:
Stocks opened lower across the board, but recovered immediately and pushed higher the rest of the session, closing in the top 25% of the day’s range. With yesterday’s advance, the Russell 2000 and NASDAQ Composite climbed back above the 10-day moving average. Although the S&P 500 is below the 10-day MA, it is still less than 1.5% off the recent swing high.
Our style of trading relies heavily on identifying the intermediate-term trend. In order to trade with the trend (when the market is in an uptrend), we have an automatic trend qualifier in place for all our daily scans, where we demand the price action be above certain moving averages. For example, unless the market is coming out of a major decline, all stocks and ETFs we scan will be trading above the 50-day MA, with the 50-day MA above the 200-day MA. The 50-day MA must be trending higher for a few months and the 200-day MA must be at the very least starting to turn up. By doing this, we force ourselves to scan for names that are in trend mode along with the market, and we avoid the temptation of bottom fishing.
The current chart of United States Natural Gas ($UNG) is a solid example of a stock/ETF that does not meet our trend criteria. As you can see, it is clearly in a downtrend with a series of lower lows and lower highs on the daily chart, as it trades in a downward trending channel (between the black trendlines). The 50-day MA (in blue) is below the 200-day MA (in orange), and the 50-day MA is in a downtrend the past few months. The 200-day MA has flattened out and is beginning to trend lower as well. This chart is exactly what we are not looking for to enter a trade. Although $UNG has found support at the lower trendline of the channel, it still has a ton of work to do to get through the $19 to $20 area, so we are not interested in this chart until that happens. There are many different investing styles to chose from, but focusing on the intermediate-term trend is what we are comfortable doing.

The chart of $UNG above was a clear example of a downtrend with lower highs and lower lows. On the weekly chart below of SPDR S&P Homebuilders ($XHB), we see the exact opposite, with the price action setting several higher highs and higher lows over the past 12 months. However, the price action has lost momentum over the past few months, and the uptrend is in danger of reversing.

$XHB was in a clear uptrend until June, when the swing low in late June undercut the prior swing low from April. During the bounce back to $31 in July, $XHB stopped well short of the prior high, putting in the first lower high in quite some time. Now, $XHB may only be in consolidation mode, and as long as it holds above the recent low in June, that could very well be the case. But if that low is broken, then we will have the first indication that a potential reversal of trend is underway.
On the stock side, we have two new buy setups along with an existing setup in $MELI. $SLM has formed a basic cup and handle type consolidation and is a potential breakout entry above $25. The other setup in in $LOCK, which has been trading in a tight range since gapping up after earnings 8 days ago. The buy entry is $LOCK is over the two-day high, with a stop beneath the low of 8/5, as well as the 10 and 20-day MAs.

We sold $TAM on the open yesterday ahead of earnings. Please note the changes to the $MELI buy setup in the watchlist section above.