Commentary:
Yesterday’s session was relatively uneventful, as the major indices failed to extend much beyond the opening fifteen minute bar’s range in either direction. Small and mid-cap stocks showed relative strength early, but failed to produce anything positive in the afternoon. The Dow Jones Industrial Average and Nasdaq Composite closed slightly lower at 0.1%. The S&P 500 and S&P Midcap 400 indices each lost 0.2%. The Russell 2000, which has been a bit more active over the past few days slid 0.6%.
The tight-ranged action was accompanied by very light volume, as turnover finished around 30% below the 50-day moving average of volume on both exchanges. We could see a full week of uninspiring price action, as traders lay low ahead of the upcoming extended holiday weekend.
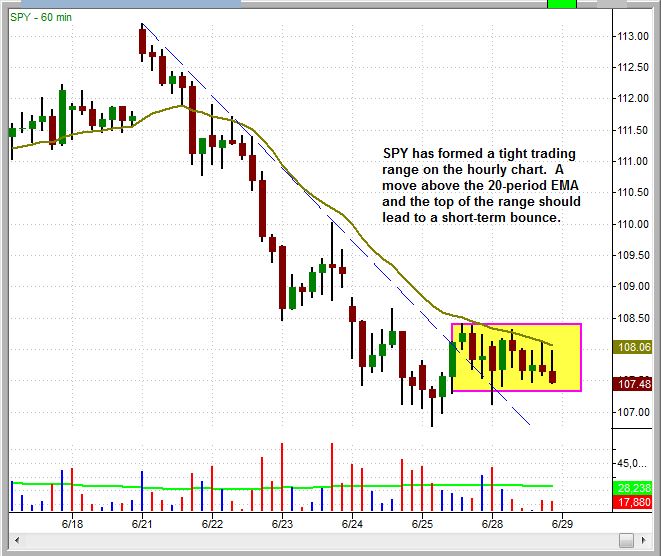
SPDRs S&P 500 (SPY) has formed a tight trading range on the hourly chart below:
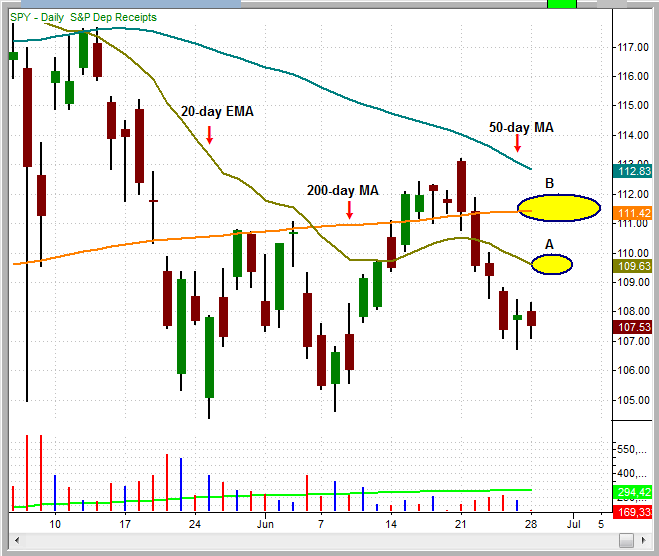
We would expect any potential rally in the SPY to be short lived, especially if the bearish volume pattern of the past few weeks persists. There is significant overhead resistance from the 200-day moving average and the downward sloping 50-day moving average around the 11.50 to 112.50 area (point B). That’s assuming the price action is strong enough to break above the 20-day EMA around 110.00 (point A).
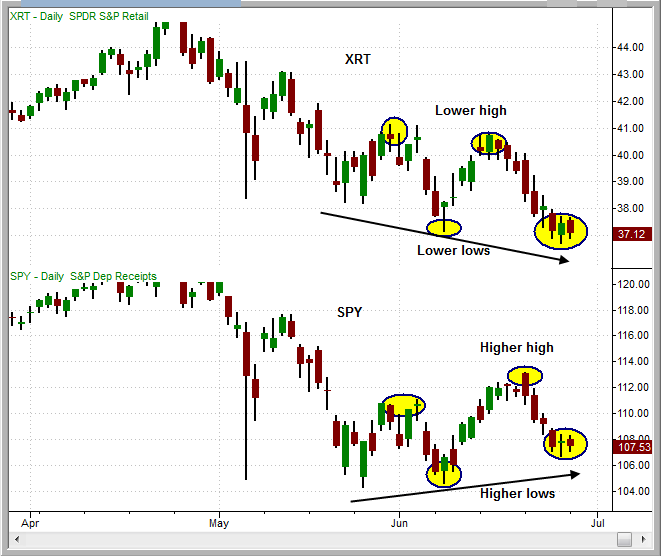
Retails stocks provided market leadership during the last rally. Now the SPDR S&P Retail (XRT) is sitting below its 200-day moving average and showing relative weakness to the S&P 500 over the past month. On the chart below we see the S&P 500 making (or attempting to make) a higher high and two higher lows, while XRT continues to make lower highs and lower lows. Even if the market is able to recover and produce a meaningful rally, it’s doubtful that XRT will play a meaningful role.
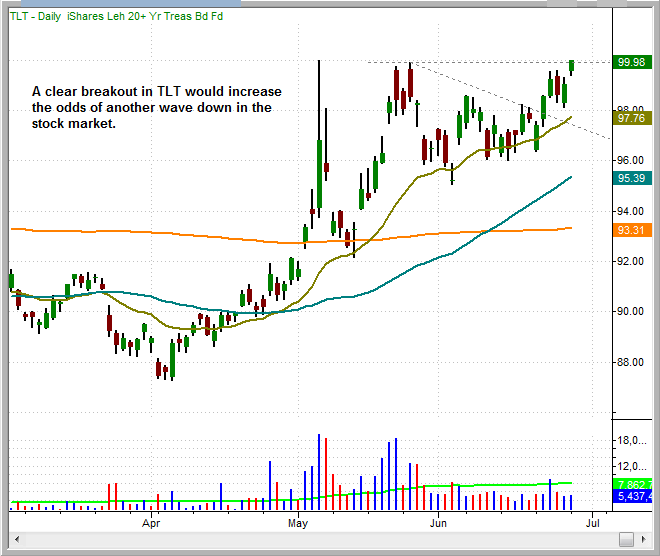
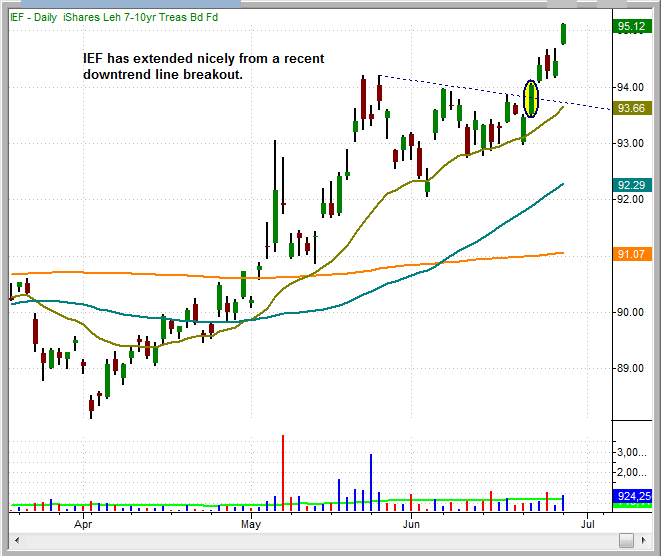
Bond ETFs are showing significant strength as of late. Money flowing into bonds signals that investors are shying away from risk, which is a negative sign for stocks. Our TLT long position is working its way toward a bullish breakout above the highs of the range with yesterday’s close:
Here is more strength from the iShares 7-10 Year Treasury (IEF):
Today’s Watchlist:

PowerShares Agricultural Fund (DBA)
Long
Shares = 800
Trigger = $24.51 (above the high of the recent range)
Stop = $23.79 (below the 20-day EMA)
Target = $25.90 area (test of February 2010 high)
Dividend Date = n/a
Daily Performance Report:
Below is an overview of all open positions, as well as a performance report on all positions that were closed only since the previous day’s newsletter. Net P/L figures are based on the $50,000 Wagner Daily model account size. Changes to open positions since the previous report are listed in red text below. Please review the Wagner Daily Subscriber Guide for important, automatic rules on trigger and stop prices.
- No changes to our open positions at this time.
- Reminder to subscribers – Intraday Trade Alerts to your e-mail and/or mobile phone are normally only sent to indicate a CHANGE to the pre-market plan that is detailed in each morning’s Wagner Daily. We sometimes send a courtesy alert just to confirm action that was already detailed in the pre-market newsletter, but this is not always the case. If no alert is received to the contrary, one should always assume we’re honoring all stops and trigger prices listed in each morning’s Wagner Daily. But whenever CHANGES to the pre-market stops or trigger prices are necessary, alerts are sent on an AS-NEEDED basis. Just a reminder of the purpose of Intraday Trade Alerts.
- For those of you whose ISPs occasionally deliver your e-mail with a delay, make sure you’re signed up to receive our free text message alerts sent to your mobile phone. This provides a great way to have redundancy on all Intraday Trade Alerts. Send your request to [email protected] if not already set up for this value-added feature we provide to subscribers.
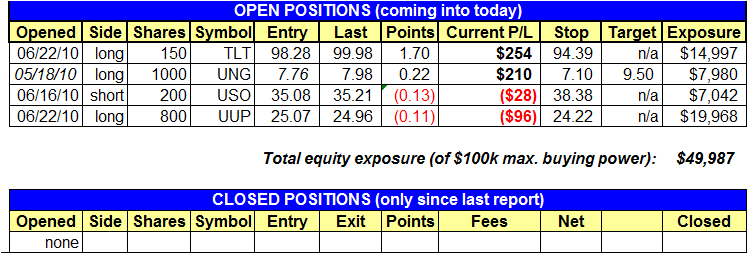
Having trouble seeing the position summary graphic above?
Click here to view it directly on your Internet browser instead.
Notes:
Edited by Deron Wagner,
MTG Founder and
Head Trader