market timing model:
Confirmed Buy – Signal generated on the close of September 4 (click here for more details) (we are on a buy signal from the close of Aug. 16)
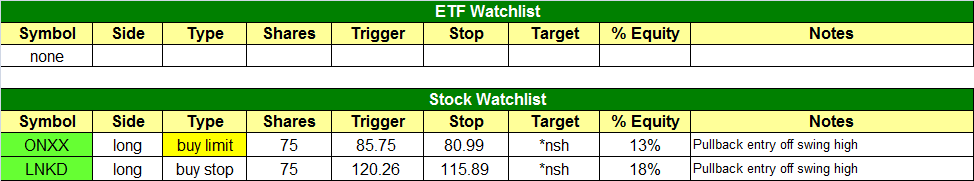
today’s watchlist (potential trade entries):
Having trouble seeing the open positions graphic above? Click here to view it directly on your web browser instead.
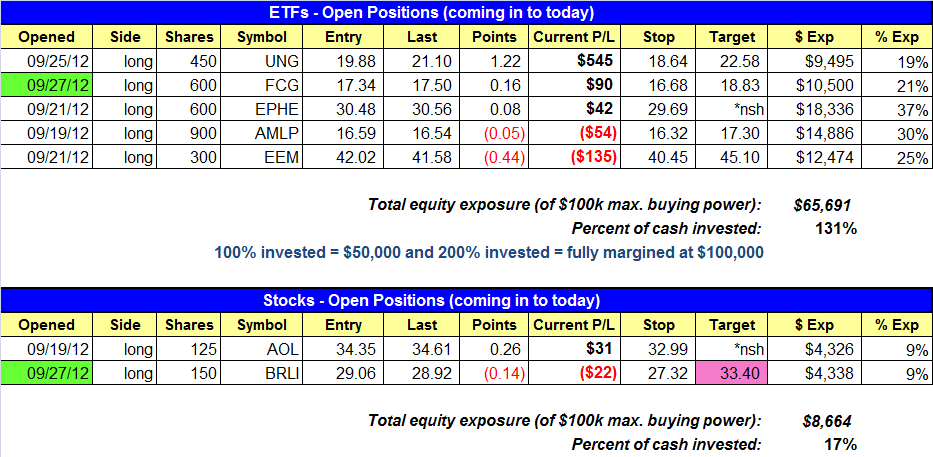
open positions:
Below is an overview of all open positions, as well as a report on all positions that were closed only since the previous day’s newsletter. Net P/L figures are based on two separate $50,000 model portfolios (one for ETFs and one for stocks). Changes to open positions since the previous report are listed in pink shaded cells below. Be sure to read the Wagner Daily subscriber guide for important, automatic rules on trade entries and exits.
Having trouble seeing the open positions graphic above? Click here to view it directly on your web browser instead.
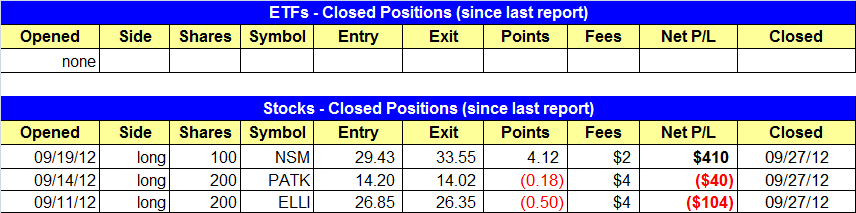
closed positions:
Having trouble seeing the closed positions graphic above? Click here to view it directly on your web browser instead.
ETF position notes:
- FCG buy entry triggered.
stock position notes:
- BRLI buy entry triggered.
- Sold NSM to lock in a decent gain.
- Sold PATK and ELLI on the open.
ETF and broad market commentary:
Stocks caught a bit of a relief bounce yesterday, as the major indices recovered a significant portion of the previous two days of losses. The Dow Jones Industrial Average ($DJIA) gained 0.5% and the S&P 500 Index ($SPX) rallied 1.0%. The Nasdaq Composite Index ($COMPX) jumped 1.4%, but the index also suffered the largest losses during the pullback. The small-cap Russell 2000 Index ($RUT) and S&P Midcap 400 Index ($MID) climbed 1.2% and 1.1% respectively. All the main stock market indexes closed in the upper quarter of their intraday highs.
Although stocks registered substantial gains yesterday, lighter volume across the board failed to confirm the advance. Total volume in the NYSE eased 15%, while volume in the Nasdaq was 1% lighter than the previous day’s level. Rather than seeing the return of institutional buying, yesterday’s rally was apparently more the result of a lack of selling pressure. Nevertheless, market internals were solid. In both exchanges, advancing volume beat declining volume by a margin of more than 4 to 1.
In last week’s commentary we provided a chart of the SPDR KBW Regional Banking ETF ($KRE), which was in pullback mode after breaking out to new 52-week highs in mid-September. Although the price action has retreated back to the rising 20-day EMA, the action as it touched the moving average (on 9/25) was ugly, as it basically closed at the lows of the day on a wide ranged bar. We continue to wait for a bullish reversal candle to signal a low-risk buy entry, but a move above the two day high is a potential entry point to begin building a position. One could wait for the price action to push higher and form a higher low (HL) at or around the 20-day EMA (within the next two weeks) before adding to the position on a potential second move out. The chart below details the ideal price action to establish a higher low.

We are already long the Alerian MLP ETF ($AMLP) but the price action is offering a potential second breakout entry, as it continues to consolidate in a tight range above the major moving averages:

The price action has really tightened up on the daily chart since the beginning of July, forming a bullish 10-week consolidation pattern around the rising 200-day moving average (in orange). The slope of the 50-day moving average (in teal) has also been trending higher since bottoming out in mid-July and has provided support on each pullback since late August. A breakout above the congestion area is the trigger.
Although yesterday’s light volume was a bit of a disappointment, the market uptrend remains intact with only a few days of distribution in the major averages. With our timing model still in buy mode, we will continue to operate with a bullish bias until there is enough evidence to shift the model into neutral or outright sell mode. Our open ETF positions are currently in good shape, especially our position in United States Natural Gas Fund ($UNG), which is up about 6% from our entry three days ago.
stock commentary:
We have two new buy setups on today’s watchlist. We are entering ONXX at market on the open (with a buy limit) IF Friday’s open is less than or equal to 85.75. With a stop just below 81.00, we do not mind taking on about 5 to 6% risk because we believe ONXX can run at least another 15 to 20% higher over the next few weeks. NOTE – ONXX is a Buy Limit order to be filled at or below (hopefully much below) 85.75 on Friday’s open. It is not a buy stop order.
LNKD is back on our watchlist after forming a bullish reversal bar on Wednesday. I have included the 14-day RSI on the chart below to show how the pullback has worked off the overbought reading from last week and early this week. We do not use RSI as a decision maker, just for confirmation on a potential trade we already like. However, I will buy a bull flag breakout even if the RSI is at an overbought level in a strong market with a stock that has top ranked fundamentals and strong technical action.

We sold ELLI at the open yesterday because we technically should have been stopped out the day before, as the price action undercut a bullish reversal bar, which invalidates the setup for us. We plan to re-enter IF a low-risk buying opportunity presents itself. If not, that is fine as well, there will be plenty of trades to take if the market remains healthy.
If you are a new subscriber, please e-mail [email protected] with any questions regarding our trading strategy, money management, or how to make the most out of this report.
relative strength combo watchlist:
Our Relative Strength Combo Watchlist makes it easy for subscribers to import data into their own scanning software, such as Tradestation, Interactive Brokers, and TC2000. This list is comprised of the strongest stocks (technically and fundamentally) in the market over the past six to 12 months. The scan is updated every Sunday, and this week’s RS Combo Watchlist can be downloaded by logging in to the Members Area of our web site.