Buy
– Timing model back to buy mode as of the close of April 10, with S&P 500 and Nasdaq breaking out on big volume. (click here for more details)
today’s watchlist (potential trade entries):

Having trouble seeing the open positions graphic above? Click here to view it directly on your web browser instead.
open positions:
Below is an overview of all open positions, as well as a report on all positions that were closed only since the previous day’s newsletter. Net P/L figures are based on two separate $50,000 model portfolios (one for ETFs and one for stocks). Changes to open positions since the previous report are listed in pink shaded cells below. Be sure to read the Wagner Daily subscriber guide for important, automatic rules on trade entries and exits.

Having trouble seeing the open positions graphic above? Click here to view it directly on your web browser instead.
closed positions:

Having trouble seeing the closed positions graphic above? Click here to view it directly on your web browser instead.
ETF position notes:
- Just a reminder that $SMH is a buy limit order. If our buy limit price is hit and your order is not filled please go long using a market order ASAP.
stock position notes:
- $KKD buy setup triggered. Just a reminder that $WDAYis a buy limit order. If our buy limit price is hit and your order is not filled please go long using a market order ASAP.
ETF, stock, and broad market commentary:
Building on the bullish momentum of the past several days, stocks kicked into high gear yesterday. Showing the most relative strength to the broad market, the NASDAQ composite jumped 1.8%, the S&P 500 advanced 1.2%, and the Dow Jones Industrial Average climbed 0.9%. All three major indices broke out to close at fresh multi-year highs. The small and mid-cap indices also registered respectable advances, but both remained below resistance of their recent highs. Turnover swelled across the board, pointing to accumulation amongst banks, mutual funds, hedge funds, and other institutions.
For the ETF section of today’s commentary, we are doing something a little different.
During yesterday afternoon’s Live Q&A Webinar, I (Deron) extensively went over the technical patterns of some of the best ETF’s on our radar screen right now. I also provided educational commentary on the power of the “undercut” trade setup, using $QQQ as an example.
Rather than attempting to repeat everything in text format everything that I already thoroughly covered in yesterday afternoon’s webinar, I have made available the video of my portion only of yesterday’s webinar, and have uploaded it to a private link on our YouTube channel. Tickers discussed in the video include: QQQ, OIH, UNG, EIDO, EPHE, EWS, SMH, and GLD (not necessarily in that order).
Please click here to watch Deron’s 18-minute live video analysis of the best ETF setups currently in the market, as well as an educational mini-lesson on the power of the “undercut.” A recap of current open ETF positions is also covered. For best quality, view video in full screen by clicking icon on bottom right of YouTube video player.”
The trade setup to buy iShares Singapore Index ($EWS) did not yet trigger, but remains on our watchlist going into today. In addition, note we have listed a NEW setup to potentially buy Semiconductor HOLDR ($SMH) on a pullback to the area of its 50-day moving average. Note this is a BUY LIMIT order, which means we will only buy if the ETF retraces down to that price level.
We have a few new stock setups on today’s watchlist. Because we plan out our trading day in advance, sometimes we have to list several setups becuase we never know exactly which ones will trigger.
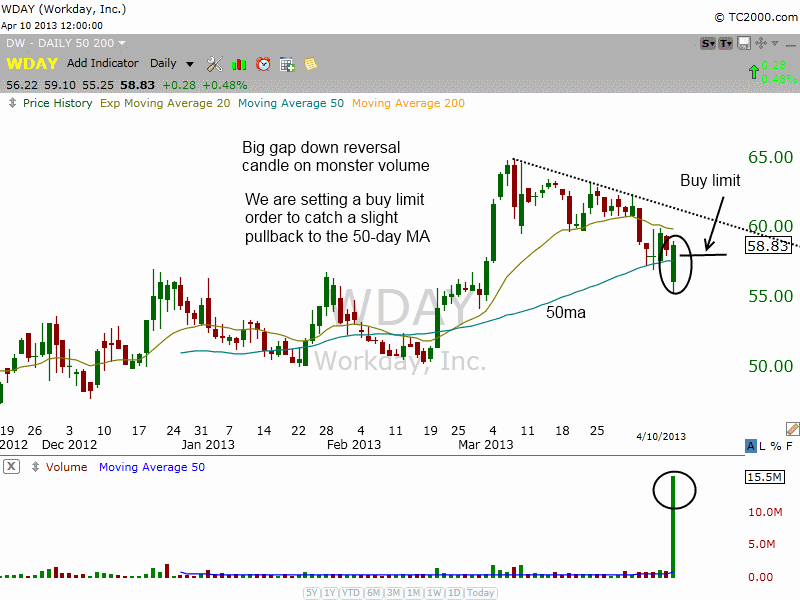
$WDAY’s gap down reversal candle yesterday on big volume was a very bullish sign.

We are looking for a slight pullback intraday to the 50-day MA as the official buy entry.
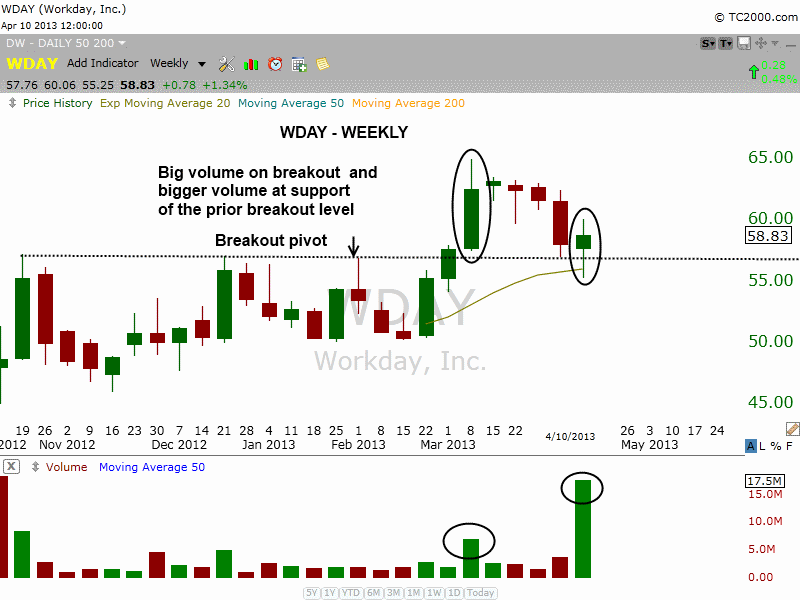
The weekly chart of $WDAY shows the powerful spikes in volume on the initial breakout and once again on the pullback to the breakout pivot yesterday.
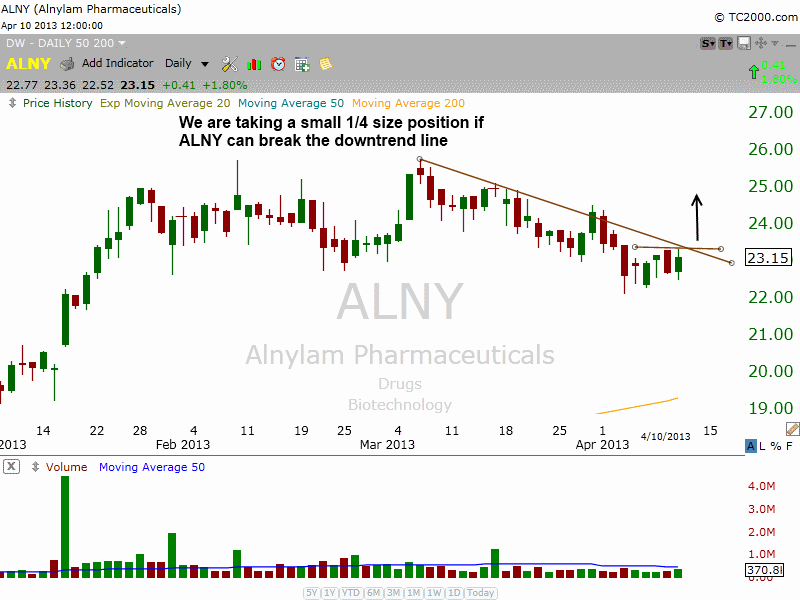
 We are also taking a shot with small size on a potential downtrend line breakout in $XIN and $ALNY:

$XIN has the better technical action, trading above all major moving averages, but its price and volume combination is a little light, so we are keeping our size small.
relative strength combo watchlist:
Our Relative Strength Combo Watchlist makes it easy for subscribers to import data into their own scanning software, such as Tradestation, Interactive Brokers, and TC2000. This list is comprised of the strongest stocks (technically and fundamentally) in the market over the past six to 12 months. The scan is updated every Sunday, and this week’s RS Combo Watchlist can be downloaded by logging in to the Members Area of our web site.