Sell – Signal generated on the close of October 12
(click here for more details)
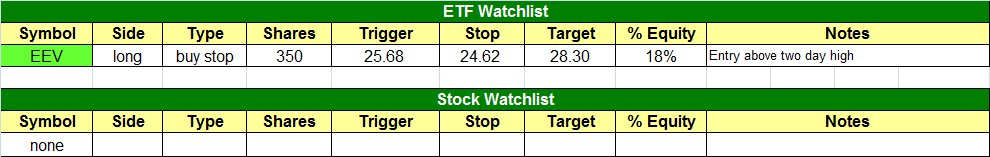
today’s watchlist (potential trade entries):
Having trouble seeing the open positions graphic above? Click here to view it directly on your web browser instead.
Below is an overview of all open positions, as well as a report on all positions that were closed only since the previous day’s newsletter. Net P/L figures are based on two separate $50,000 model portfolios (one for ETFs and one for stocks). Changes to open positions since the previous report are listed in pink shaded cells below. Be sure to read the Wagner Daily subscriber guide for important, automatic rules on trade entries and exits.
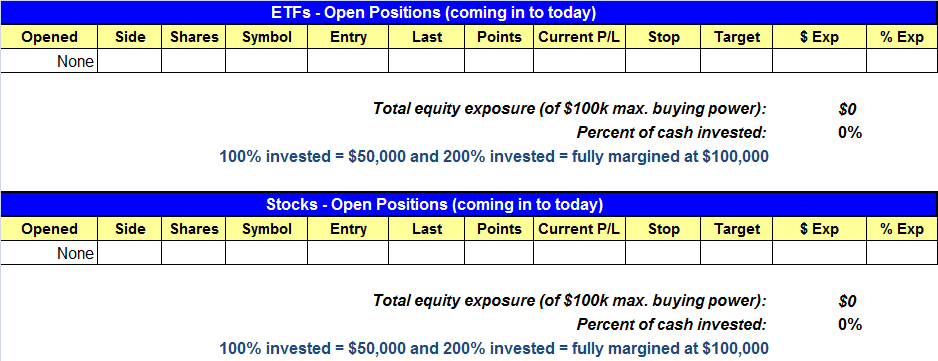
Having trouble seeing the open positions graphic above? Click here to view it directly on your web browser instead.
closed positions:

Having trouble seeing the closed positions graphic above?
Click here to view it directly on your web browser instead.
ETF position notes:
- Cancelled the XHB setup.
stock position notes:
- No trades were made.
ETF and broad market commentary:
After trading in a tight, sideways range throughout the first half of the day, stocks dipped lower in the early afternoon, but recovered into the close to finish near the flatline. The Nasdaq, S&P 500, and Dow Jones all finished within 0.1% of unchanged levels. For the third day in a row, the small and mid-cap stock indices outperform by a few tenths of a percent, but those indexes also typically show greater losses than the rest of the major indices on down days. Total volume in the NYSE and Nasdaq averaged 8% lighter than the previous day’s levels. Lower volume during consolidation days is common.
Going into yesterday’s session, we were stalking SPDR S&P Homebuilders ETF ($XHB) as a potential short sale entry if it traded below the November 19 low. However, the ETF opened slightly higher, then rallied to close near the previous day’s high. As such, the ETF did NOT trigger for short sale entry, and has been temporarily removed from our “official” watchlist as a swing trade setup. Whenever we list a swing trading setup that does not hit our trigger price, we don’t care because there was “no harm, no foul” for disciplined traders.
One ETF that has been “officially” added to today’s ETF Watchlist as a potential buy entry is ProShares UltraShort Emerging Markets ETF ($EEV). As you can see on the chart below, EEV broke out above a six-month downtrend last week, and has now pulled back to near-term support of its 20-day exponential moving average, which recently crossed above the 50-day moving average. This is a bullish trend reversal signal. With the ETF moving higher in yesterday’s session, but closing just below the previous day’s (November 19) low, we are now stalking EEV for potential buy entry above the two-day high. Please note our exact entry, stop, and target prices in the ETF Watchlist section of the newsletter above. The technical trade setup is shown on the daily chart below:

Although the main stock market indexes were flat yesterday, there were at least two ETFs we have been monitoring that pulled back to near-term support levels. Specifically, they retraced to test or “undercut” their 20-day exponential moving averages. One of those ETFs was Direxion 20-Year Treasury Bull 3x ($TMF), a fixed-income ETF that roughly follows the price of the US long-term treasury bond, but is leveraged at a 3 to 1 ratio. Last week, we sold this ETF for substantial profit, after it broke out above resistance of a four-month downtrend line. However, the ETF has remained on our radar as a potential swing trade re-entry on a pullback. The current pullback that followed the recent breakout above the downtrend line is shown on the daily chart of TMF below:

As you can see, TMF sold off sharply yesterday, and closed just below near-term support of its 20-day exponential moving average. Such a price retracement off its recent highs provides a low-risk re-entry point to buy this ETF. However, remember that we do not blindly try to anticipate where a pullback will end and find support. Rather, we must now wait for the formation of a bullish reversal candlestick within the next several days, then look to buy TMF above the previous day’s high, which would confirm the pullback off the highs has ended, and TMF is likely to resume its bullish trend reversal. Therefore, although TMF is not yet listed on our watchlist as an “official” buy entry, it is now on our internal watchlist as a potential trade setup we are monitoring for the proper trigger point for buy entry.
Another such ETF with a similar pattern is ProShares UltraShort Basic Materials ETF ($SMN). After buying the breakout above its downtrend line, we sold this ETF into strength last week for a 9.2% gain on an 8-day holding period. Now, it has pulled back to near-term support of its 20-day EMA, but probably needs another day or two to either “undercut” support of the 20-day EMA, or at least form a bullish reversal candle, before we would look for an actual re-entry point into this ETF. Like TMF, this setup in SMN has been added to our internal watchlist as a potential near-term buy entry. The daily chart pattern of SMN is shown below:

Just a reminder that the US stock markets are closed on Thursday, November 22, for the Thanksgiving Day holiday. As such, The Wagner Daily will not be published tomorrow. Furthermore, since the market closes early on November 23, this Friday’s newsletter will be an abbreviated version that contains minimal commentary and only an update on any open positions or new trade setups. Have a fantastic and fun time with your friends and/or family over the holiday.
Our scans have yet to produce much in the way of low-risk entry points on the short side. Locating solid short setups just a few days after an ugly selloff is asking a bit too much from the market, as it takes some time for the market to work off the oversold conditions. Patience is key right now as we want to let the market come to us.
$SBUX remains on our watchlist, as it has bounced higher on very light volume, but there is still no low risk entry point. $MCD is another potential short entry we are monitoring if it can rally to the 87.50 area and stall out. The list of short candidates should improve when the market begins to lose some steam with one or two days of stalling action. For now we remain 100% in cash in the stock portfolio.
If you are in front of a computer during the day please try to catch our Q&A webinar Wednesday, at 12pm est. If you are new to our service or to trading, this is your chance to ask specific questions about our methodology. If you want to learn how to become a profitable trader this is a great place to start. Paper trading is ok, but nothing beats trading real money and then having someone with experience to help you along the way. At the very least, you will shorten the learning curve by a few years if you put a little effort into learn our systematic approach to swing trading.
If you are a new subscriber, please e-mail [email protected] with any questions regarding our trading strategy, money management, or how to make the most out of this report.
relative strength combo watch list:
Our Relative Strength Combo Watchlist makes it easy for subscribers to import data into their own scanning software, such as Tradestation, Interactive Brokers, and TC2000. This list is comprised of the strongest stocks (technically and fundamentally) in the market over the past six to 12 months. The scan is updated every Sunday, and this week’s RS Combo Watchlist can be downloaded by logging in to the Members Area of our web site.