Confirmed Buy– Signal generated on the close of January 22 (click here for more details)
today’s watchlist (potential trade entries):

Having trouble seeing the open positions graphic above? Click here to view it directly on your web browser instead.
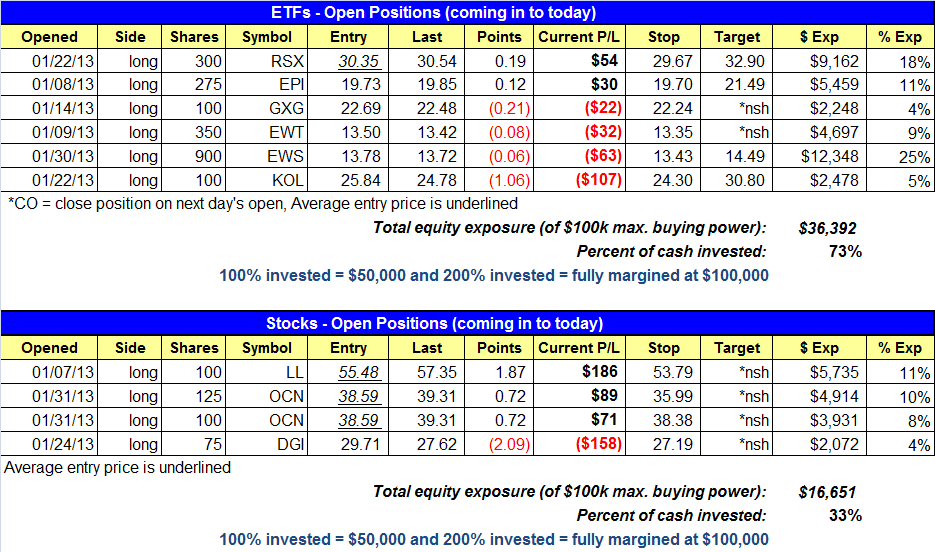
open positions:
Below is an overview of all open positions, as well as a report on all positions that were closed only since the previous day’s newsletter. Net P/L figures are based on two separate $50,000 model portfolios (one for ETFs and one for stocks). Changes to open positions since the previous report are listed in pink shaded cells below. Be sure to read the Wagner Daily subscriber guide for important, automatic rules on trade entries and exits.
Having trouble seeing the open positions graphic above? Click here to view it directly on your web browser instead.
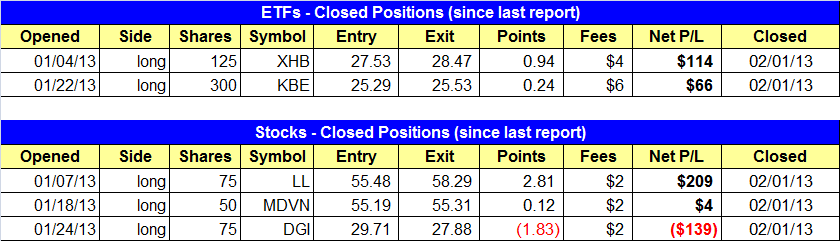
closed positions:
Having trouble seeing the closed positions graphic above? Click here to view it directly on your web browser instead.
ETF position notes:
- Stopped out of $XHB and $KBE.
stock position notes:
- Stopped out of $LL (partial), $MDVN (full), and $DGI (partial).
ETF, stock, and broad market commentary:
Last Friday’s breakout proved to be short-lived, as stocks sold off to give back all the previous day’s gains and then some. As we have seen many times in recent weeks, the Nasdaq Composite again showed the most relative weakness of the major indices. The tech heavy index shed 1.5%. The rest of the main stock market indexes each fell around 1%.
The one silver lining behind yesterday’s bearish price action was that turnover eased across the board. In the Nasdaq, total volume was 8% lighter than the previous day’s level. Trade in the NYSE was similarly lower by 13%. This means that, despite the substantial percentage decline in the broad market, both the S&P and Nasdaq averted a “distribution day” (higher volume selling).
After looking through hundreds of charts after the close, we saw numerous false breakouts, as well as stalling action. Nevertheless, this does not spell the end of the rally because false breakouts sometimes have a tendency to merely shake out the “weak hands” before subsequently making an even more powerful move to the upside several days or weeks later.
For now, it’s simply too early to tell whether there was any significant technical damage done by yesterday’s decline. If leading individual stocks and ETFs fail to hold support of their 20-day exponential moving averages for more than a day or two, that would obviously be concerning in the near-term. However, as long as the broad market continues to avoid bouts of institutional selling (distribution), stocks could still eventually recover and head back to new highs when traders are least expecting it.
It looks like our call to tighten up stops over the weekend was the right thing to do. We stopped out of $KBE and $XHB for small gains in the model ETF portfolio. With the market printing back to back reversal candles, the volatility has definitely picked up.
As always, we will continue reacting to price action in the market, rather than trying to predict it. Our disciplined, rule-based market timing system remains on a buy signal, so we still expect any pullback to be short-lived. But all bets are off on the long side if higher volume selling starts entering the market.
The back to back reversal candles created a few false breakouts in ETFs that we are monitoring. iShares NASDAQ Biotechnology Index ($IBB) broke out from a tight-ranged handle on Friday but failed to follow through:

In a strong uptrend there should always be a steady rotation of breakouts, but when a market becomes extended, the ETFs that are last to breakout are sometimes the worst trades to take, as they can fall apart quickly when the market corrects. Sometimes laggard ETFs breaking out to new highs is a sign that the market is getting a bit ahead of itself and needs a few days/weeks of rest. With $IBB, the best case scenario (other than to return above the two-day high) is for the price action to undercut the 20-day EMA and wipe out all the obvious stops around 144.00. Any shakeout below the 20-day EMA should be followed by a quick reversal back above the 20 EMA, if the selloff was just a shakeout.
Like $IBB, iShares MSCI Indonesia ($EIDO) was late to the party in finally breaking out last Friday after months of consolidation. $EIDO is above the 31.00 breakout level, so the trade could still work out, as about half of all breakouts at some point test the breakout level before following through.

While the timing was off in both breakouts above, we will continue to monitor the price action for a low-risk entry point. If the stock/ETF is still under accumulation, then a false breakout should run its course in three to six days before reversing.
On the stock side, we stopped out of $LL, locking in about $200 of profit. $MDVN stopped us out just above break-even. We basically ditched the remaining half position (at break-even) due to the lack of strength in the biotech sector as of late. $DGI stopped us out of half our position and closed at the lows of the day (not good).
We have been monitoring $REGN for quite some time, and the price action as of late has not been impressive. The price action has refused to climb back above the 50-day MA, and the 20-day EMA has crossed below the 50-day MA. As always, we look for stocks to be setting higher swing lows within the base as a clue that the stock is under accumulation.

If $REGN is unable to hold Monday’s low, then odds are it will test $164 for the third time….no higher swing lows. $REGN reports earnings on February 14. The lack of follow through on the recent move off the lows suggests that it probably will not do much of anything ahead of its report.
If you are a new subscriber, please e-mail [email protected] with any questions regarding our trading strategy, money management, or how to make the most out of this report.
relative strength combo watchlist:
Our Relative Strength Combo Watchlist makes it easy for subscribers to import data into their own scanning software, such as Tradestation, Interactive Brokers, and TC2000. This list is comprised of the strongest stocks (technically and fundamentally) in the market over the past six to 12 months. The scan is updated every Sunday, and this week’s RS Combo Watchlist can be downloaded by logging in to the Members Area of our web site.