Sell Mode
– Timing model generated sell signal on close of February 25 (click here for more details)
today’s watchlist (potential trade entries):

Having trouble seeing the open positions graphic above? Click here to view it directly on your web browser instead.
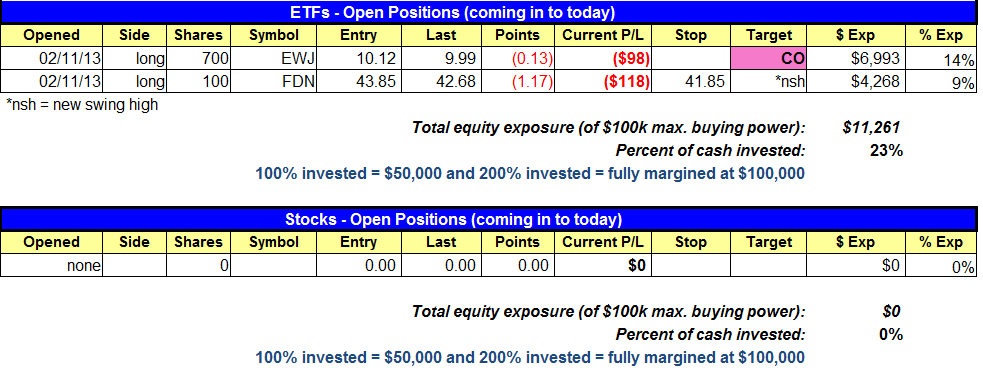
open positions:
Below is an overview of all open positions, as well as a report on all positions that were closed only since the previous day’s newsletter. Net P/L figures are based on two separate $50,000 model portfolios (one for ETFs and one for stocks). Changes to open positions since the previous report are listed in pink shaded cells below. Be sure to read the Wagner Daily subscriber guide for important, automatic rules on trade entries and exits.
Having trouble seeing the open positions graphic above? Click here to view it directly on your web browser instead.
closed positions:
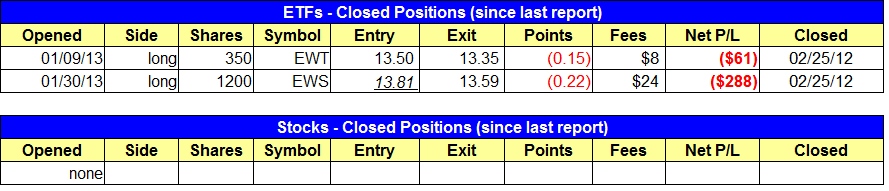
Having trouble seeing the closed positions graphic above? Click here to view it directly on your web browser instead.
ETF position notes:
- $EWS and $EWT stopped out.
stock position notes:
- No trades were made.
ETF, stock, and broad market commentary:
After a one day bounce on light volume, stocks suffered significant losses across the board on higher volume. Because the market rally was slow and steady with gains of 0.5% on most up days, yesterday’s -1.8% loss in the S&P 500 created a very wide and ugly, bearish reversal candle.
The higher volume selloff produced another distribution day for the S&P 500, which has now logged three distribution days in the past four sessions. Yesterday’s distribution generated a sell signal on our timing model. With the model now in sell mode the short side is in play.
It’s always a bad sign when distribution days cluster over a very short period of time:

The Nasdaq 100 tracking ETF $QQQ closed back below the 50-day MA yesterday, with an ugly, wide ranged reversal candle. Although the 200-day MA support level is just below, when the market is in distribution mode the price action can slice through important moving averages like a hot knife through butter. Moving averages work really well in a bull market, but not so much when conditions turn sour.

Comparing the price action during the last rally, we see quite a bit of negative divergence in $QQQ. While the S&P cleared the prior highs, $QQQ struggled with the initial swing high of 12/19.

Operating with the idea that support of the 200-day MA will not hold, we expect $QQQ to test the prior swing low around 63.00 – 64.00 over the next two weeks. Rather than shorting $QQQ, we plan to go with the leveraged Ultrashort QQQ product, ($QID). Trade details can be found in the watchlist section above.
We stopped out of $EWS and $EWT late Monday, leaving $FDN and $EWJ as the only open positions. We are closing $EWJ on the open and $FDN is just a few cents from our stop.
On the stock side, we have a few potential short entries on today’s watchlist. $DKS is a former leader that has topped out after a significant advance, and has formed a complex head and shoulders pattern, with two heads at the highs of the pattern.

The head and shoulders pattern is confirmed when the price action breaks the neckline of the pattern, which is the line drawn near 44.00. We are establishing a “cheat” entry below yesterday’s reversal candle low and the 200-day MA. Yesterday’s spike was a false breakout and a 20-day high, which presents us with a pretty low risk entry point and a tight stop.

If you are a new subscriber, please e-mail [email protected] with any questions regarding our trading strategy, money management, or how to make the most out of this report.
relative strength combo watchlist:
Our Relative Strength Combo Watchlist makes it easy for subscribers to import data into their own scanning software, such as Tradestation, Interactive Brokers, and TC2000. This list is comprised of the strongest stocks (technically and fundamentally) in the market over the past six to 12 months. The scan is updated every Sunday, and this week’s RS Combo Watchlist can be downloaded by logging in to the Members Area of our web site.