market timing model: Buy
Current signal generated on close of September 9.We are no longer in confirmed buy mode, but remain in buy mode (which is holding on by a thread). Portfolio exposure depends on how well positions have held up, but anywhere from 50% to 100% (if positions are in good shape) is okay.
Past signals:
- Neutral signal generated on close of August 15
- Buy signal generated on close of July 11
- Neutral signal generated on close of July 5
- Sell signal generated on close of June 24
today’s watchlist (potential trade entries):

Having trouble seeing the open positions graphic above? Click here to view it directly on your web browser instead.
open positions:
Below is an overview of all open positions, as well as a report on all positions that were closed only since the previous day’s newsletter. Changes to open positions since the previous report are listed in pink shaded cells below. Be sure to read the Wagner Daily subscriber guide for important, automatic rules on trade entries and exits. Click here to learn the best way to calculate your share size.

Having trouble seeing the open positions graphic above? Click here to view it directly on your web browser instead.
closed positions:
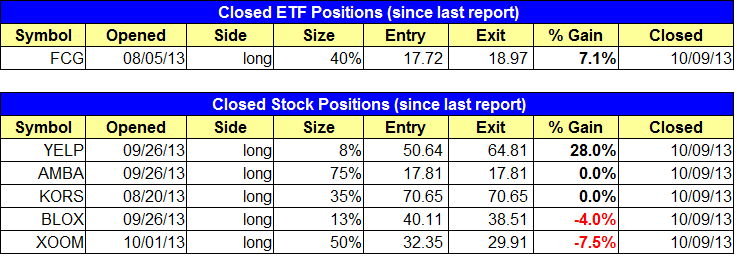
Having trouble seeing the closed positions graphic above? Click here to view it directly on your web browser instead.
ETF position notes:
- Sold half of $FCG to lock in a 7% gain.
stock position notes:
- Stopped out of $XOOM for a 7.5% loss. Sold partial size of $BLOX for a 4% loss. Sold partial size of $YELP for a 28% gain. Sold $AMBA and $KORS at break-even.
ETF, stock, and broad market commentary:
Stocks tried to gain some traction, with the S&P 500 closing slightly positive on the day, but with a decent reversal candle on higher volume. The Dow Jones found a bit of support at the 200-day MA, and was the biggest winner on the day at only +0.2%. The NASDAQ Composite did close below the 50-day MA, and in negative territory, but well off the lows of the session.
While the US market has taken a bit of a hit, BRIC ETfs have held up surprisingly well. Brazil, Russia, India, and especially China, have for the most part ignored the selloff in the US market.
Guggenheim China Small Cap ETF ($HAO) has shown great relative strength as of late, breaking out above resistance at $25 while the S&P 500 pulled back 5% off a recent swing high. We like the bullish reversal candle last week, which opened below the prior week’s low and closed above the prior week’s high. The price closed near the dead highs of the week as well.

On the daily chart, we see that the 50-day MA has crossed above the 200-day MA, which is a bullish intermediate-term buy signal. All major moving averages on the chart are in a clear uptrend, from the 10-day MA to the 200-day MA. We are placing $HAO on today’s watchlist. Trade details can be found in the watchlist section above.

Per yesterday’s plan, we sold half of our position in $FCG to lock in a 7% gain, and we also raised the stop on the remaining shares. Our $EWJ long finally showed some life yesterday, bouncing off the 50-day MA. The bounce could spark the next wave up if momentum builds.
On the stock side we sold partial size in $YELP to lock in a 28% gain. We also sold half of our position in $BLOX for a 4.0% loss, and $XOOM stopped us out with a 7.0% loss. We also stopped out of $KORS and $AMBA at break-even.
Please note the changes made to the $SLCA stop (share size). Since $SLCA has been so strong as of late, we plan to sell only half of our 40% position at the tight stop (rather than the full 40% we mentioned yesterday). After the sell, our $SLCA long exposure should be at 55% percent.
Leading stocks have been roughed up a bit the past few days, but most patterns still remain in decent shape. All stocks eventually consolidate, so pulling back 15-25% off a swing high after a strong advance is normal action, and that is what we are currently seeing in $LNKD.

$LNKD could potentially be forming the lows of its current base this week, as the price action has dipped about 11% below the 10-week MA. The last bottom in $LNKD occurred when the action reversed off the lows after a 10% dip below the 10-week MA. The one issue we have witht he current action is the high volume on the break of the 10-week MA. However, if $LNKD can finish out the week in the top third of the week’s range, then that increase in volume will not look so bad.