Current signal generated on close of September 9.
Portfolio long exposure can be anywhere from 50% to 100% or more if you have positions that help up while the market sold off.
Past signals:
- Neutral signal generated on close of August 15
- Buy signal generated on close of July 11
- Neutral signal generated on close of July 5
- Sell signal generated on close of June 24
today’s watchlist (potential trade entries):

Having trouble seeing the open positions graphic above? Click here to view it directly on your web browser instead.
open positions:
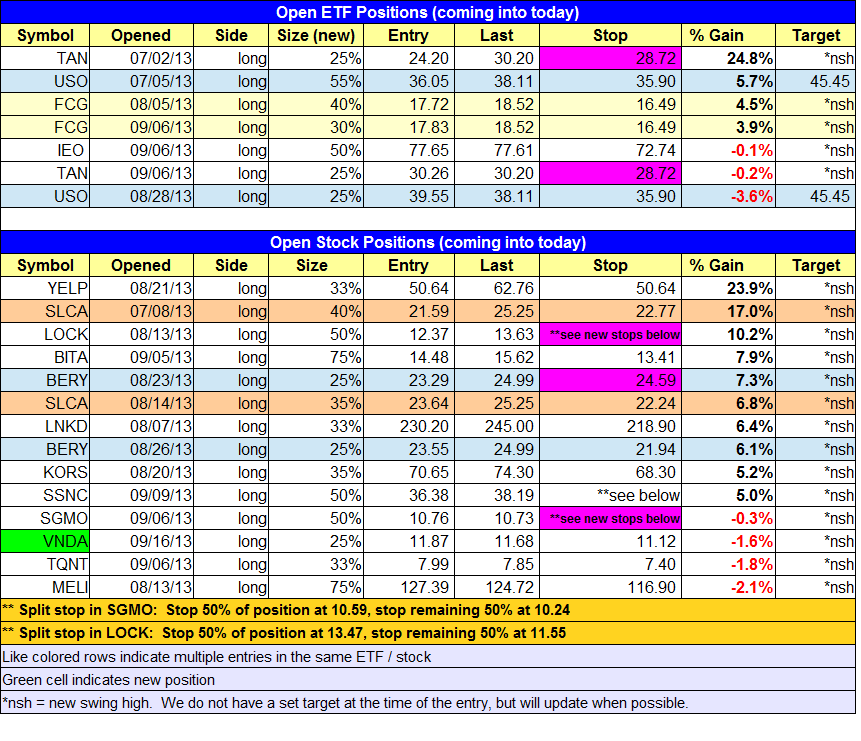
Below is an overview of all open positions, as well as a report on all positions that were closed only since the previous day’s newsletter. Changes to open positions since the previous report are listed in pink shaded cells below. Be sure to read the Wagner Daily subscriber guide for important, automatic rules on trade entries and exits. Click here to learn the best way to calculate your share size.
Having trouble seeing the open positions graphic above? Click here to view it directly on your web browser instead.
closed positions:

Having trouble seeing the closed positions graphic above? Click here to view it directly on your web browser instead.
ETF position notes:
- No trades were made.
stock position notes:
- $VNDA buy stop triggered.
ETF, stock, and broad market commentary:
A news driven gap up propelled the stock market close to 1% higher on Monday’s open; however, the initial strength lacked any follow through, as stocks sank lower the rest of the day. While the Dow Jones managed to hold on to most of its gap up with an 0.8% gain, the NASDAQ Composite closed in negative territory, giving back the entire gap. Total volume jumped on both exchanges, indicating that there was some selling into strength by institutions.
Over the past few days, we have noticed a drop off in the number of quality buy setups in our scans, which is to be expected when the market is extended in the short-term. A few days of selling action to scare off some of the “late to the party” longs would be ideal and possibly present us with low risk pullback entries.
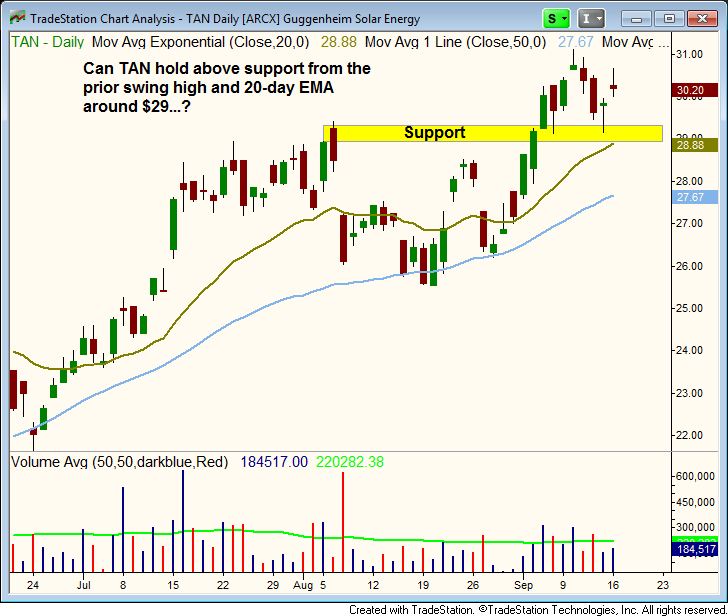
To prevent against a false breakout, we are raising the stop in Guggenheim Solar Energy ($TAN) to just below $29, where there is support from the 20-day EMA and prior swing highs within the base.
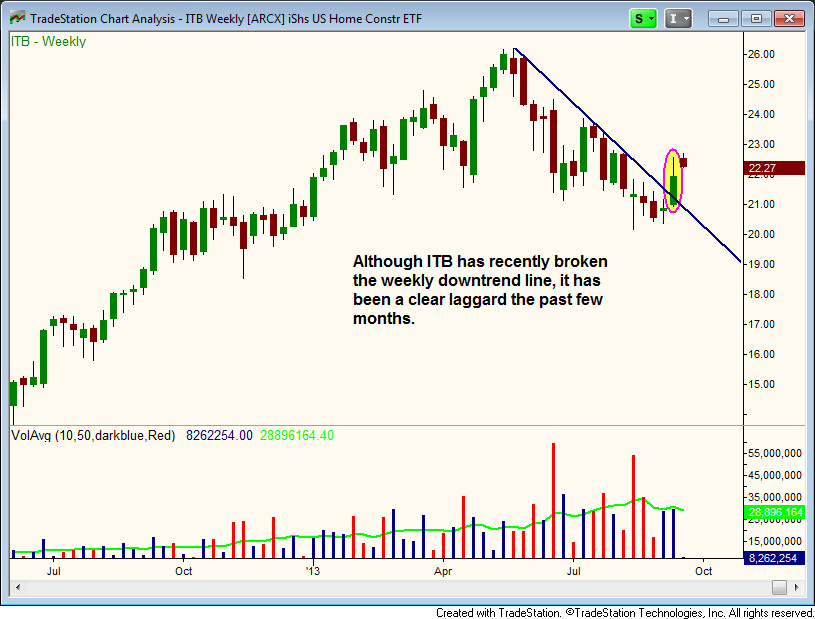
Relative strength is an important tool we use every day in scanning for stocks and ETFs. Pattern relative strength, where we compare significant swings highs and lows in a stock or ETF against a broad market index like the S&P 500 is an easy way of identifying what is and isn’t strong. A good example of this is the recent price action in the iShares U.S. Home Construction ETF ($ITB), which just broke above the downtrend line on the weekly chart below.
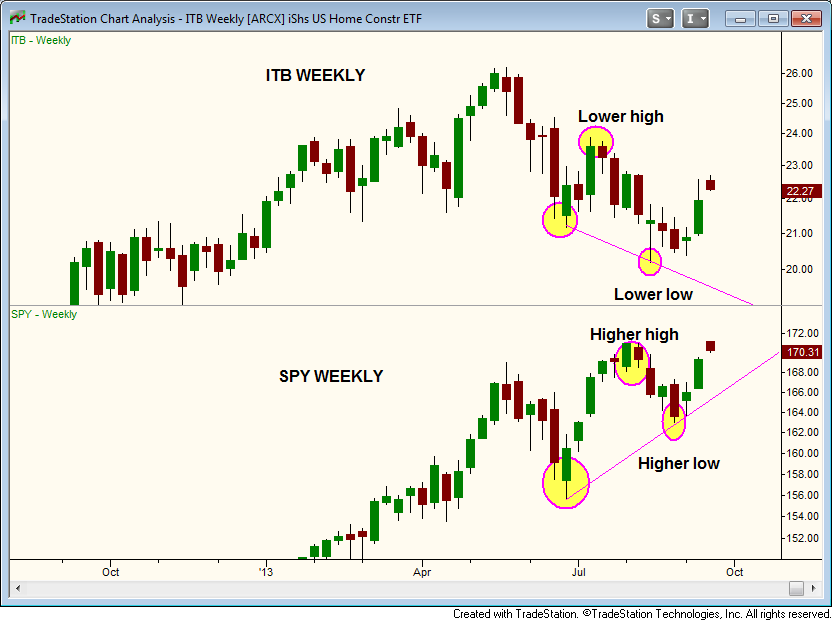
Although the downtrend line breakout looks bullish on the chart above, the weekly chart below shows the relative weakness in $ITB, which has been trending lower, setting lower highs and lower lows, while the $SPY has been in a clear uptrend, with higher highs and higher lows. This is a pretty simple concept, but highly effective. Stocks or ETFs that hold up better than a broad market average during a correction tend to be the first charts to break out when he market becomes healthy.
Buy setups in $EGPT and $SCTY remain live, but there are no new setups for today. On the stocks side, we raised the stop in $SGMO, as the price action has simply failed to impress. The first stop is pretty tight (near break-even) due to yesterday’s selloff, but the second stop gives a little bit of wiggle room.
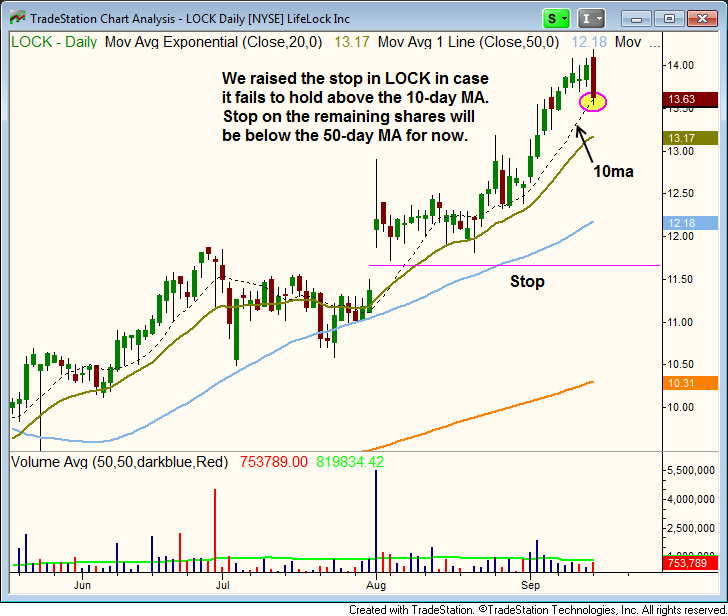
$LOCK pulled back to the 10-day MA yesterday, and so we are raising the stop for half the position to lock in gains. We will keep a loose stop on the remaining position to see if we can hold on for a bigger gain. With the remaining position, we want the price action to hold above the 50-day MA.
A short-term market pullback may present us with opportunities to add to existing positions in top ranked stocks such as $LNKD or $KORS.