market timing model:
Confirmed Buy – Signal generated on the close of September 4 (click here for more details) (we are on a buy signal from the close of Aug. 16)
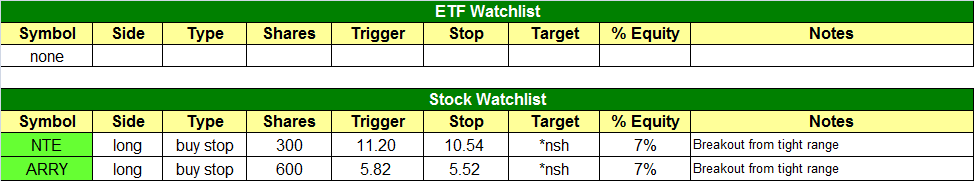
today’s watchlist (potential trade entries):
Having trouble seeing the open positions graphic above? Click here to view it directly on your web browser instead.
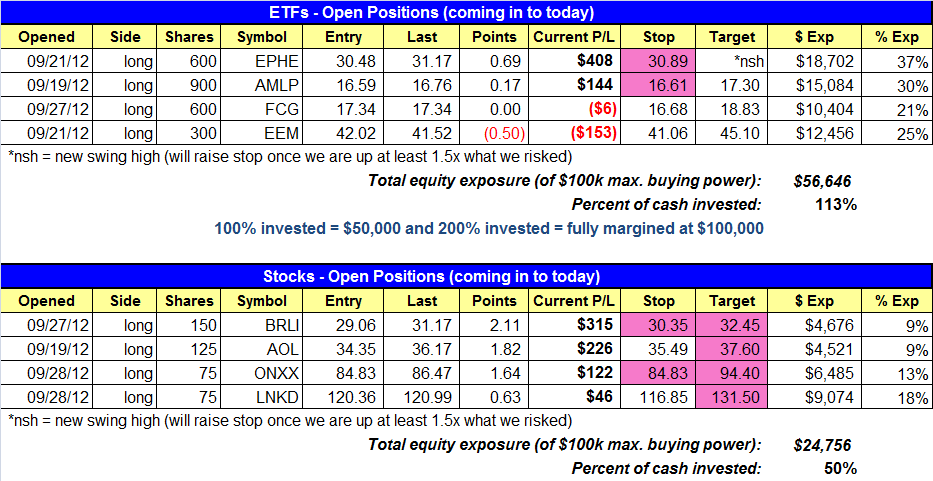
open positions:
Below is an overview of all open positions, as well as a report on all positions that were closed only since the previous day’s newsletter. Net P/L figures are based on two separate $50,000 model portfolios (one for ETFs and one for stocks). Changes to open positions since the previous report are listed in pink shaded cells below. Be sure to read the Wagner Daily subscriber guide for important, automatic rules on trade entries and exits.
Having trouble seeing the open positions graphic above? Click here to view it directly on your web browser instead.
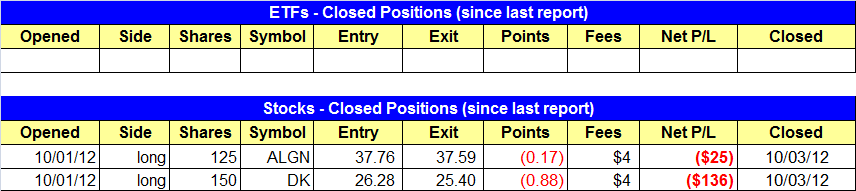
closed positions:
Having trouble seeing the closed positions graphic above? Click here to view it directly on your web browser instead.
ETF position notes:
- Note the new stop prices above.
stock position notes:
- Sold DK and ALGN.
ETF and broad market commentary:
After chopping around in indecisive fashion throughout the entire day, the Nasdaq Composite ($COMPX) rose 0.5% yesterday, the S&P 500 Index ($SPX) gained 0.4%, and the Dow Jones Industrial Average ($DJIA) eked out a gain of 0.1%. While the gains in the most popular stock market indexes were positive, relative weakness in the small and mid-cap arena was disappointing. The S&P Midcap 4000 Index ($MID) was unchanged, but the small-cap Russell 2000 Index ($RUT) actually declined 0.2%. Most of the main stock market indexes closed in the upper third of their intraday trading ranges, yet still exhibited a lack of conviction into the close.
Total volume in the NYSE ticked 7% higher, as turnover in the Nasdaq edged 8% above the previous day’s level. In both exchanges, advancing volume was roughly on par with declining volume. Total volume levels in both exchanges was also approximately in parity with 50-day average levels. Overall, market internals and the correlation between volume and price yesterday was inconclusive with regard to institutional trading activity.
In mid-September, we pointed out the relative strength that was being exhibited by the banking sector. Specifically, we looked at the chart pattern of S&P Regional Bank SPDR ($KRE) because it was showing the most relative strength among the various financial or banking ETFs. At the time, we were looking for a pullback in KRE that would’ve provided us with a positive reward to risk ratio for new swing trade entry. As anticipated, KRE indeed pulled back to near-term support of its 20-day exponential moving average about one week after our initial analysis, but the ETF never provided us with an ideal buy entry. This is because the pullback is taking too long, and KRE has not yet formed a bullish reversal bar on its daily chart either. Nevertheless, KRE is still holding support in a very tight, sideways trading range over the past six days. This is shown on the daily chart of KRE below:

While we were looking for a pullback to the 20-day exponential moving average, the best Pullback trade setups are in ETFs that are steadily trending higher, retrace to kiss their 20-day exponential moving averages for only a day or two, then immediately resume their uptrends. With KRE, we don’t like that the ETF is taking too long to respond to its current near-term pullback. Furthermore, if one compares the recent price action of KRE with the main stock market indexes, it becomes apparent that this ETF has lost relative strength to the broad market. Still, it would be relatively low-risk swing trade entry to buy a partial position of KRE above resistance of its six-day high (above the $29 area). At most, we would only take about a 1/3 of normal position size at current levels, then add to the position upon confirmation of the ETF resuming its uptrend. Scaling into a position that has a decent chart pattern, but is not acting exactly as you would like to see, is a good way to reduce risk, while still allowing for potential gains to the upside.
Although some commodity ETFs have a low correlation to the direction of the actual stock market indexes, one ETF that actually has been showing a close correlation to the broad market in recent months is the US Oil Fund ($USO). Although it has been a laggard, it has been rallying since the broad market began rallying in June, but now is breaking down below major levels of price support. The daily chart of USO is shown below:

As annotated on the chart above, notice that USO just broke below a key area of price support yesterday, and is apparently headed down to test support of its lows of June. Because of the correlation between the price action of USO and the main stock market indexes since June, we view the leading breakdown of support as a negative sign for the overall stock market. Nevertheless, the major indices appear to be correcting more by time (building a base of consolidation), rather than retracing to intermediate-term support of their 50-day moving averages. Stocks may simply build a base for a little while longer, then rally on their merry way back up to test the recent highs.
Overall, we are currently maintaining enough exposure on the long side of the broad market to realize a substantial gain if the main stock market indexes move higher from here. As such, we are not listing KRE as an official buy setup today. But like a handful of other ETFs we discussed in recent days, KRE remains on our radar screen and our internal watchlist. For now, until the market proves it intends to resume its uptrend, we will simply focus on managing the exposure of our current positions.
stock commentary:
BRLI was our best performing position yesterday, as it broke out new highs on big volume. LNKD also moved above the minor swing high and hopefully it can continue to run higher. ONXX just can’t seem to get going, while AOL continues to slowly push higher.
We stopped out of two positions yesterday. One was a near breakeven stop in ALGN and the other was a $125 loss in DK. That is an average of about $80 per loss (which is extremely low). Although yesterday was a step in the right direction for the bulls, the averages have yet to put in an impressive accumulation day in quite some time. Our stops remain pretty tight, as we would rather limit losses and/or take small gains than sit through a potential second leg down IF the market breaks to the downside.
We do have two new setups on today’s watchlist in ARRY and NTE. NTE is a potentially explosive situation with a tight stop….so it is a GONG setup, meaning Go Or No Go (should work right away). Note that we are taking reduced size on both positions due to less than ideal market conditions.

If you are a new subscriber, please e-mail [email protected] with any questions regarding our trading strategy, money management, or how to make the most out of this report.
relative strength combo watchlist:
Our Relative Strength Combo Watchlist makes it easy for subscribers to import data into their own scanning software, such as Tradestation, Interactive Brokers, and TC2000. This list is comprised of the strongest stocks (technically and fundamentally) in the market over the past six to 12 months. The scan is updated every Sunday, and this week’s RS Combo Watchlist can be downloaded by logging in to the Members Area of our web site.