market timing model:
Neutral – Signal generated on the close of August 2 (click here for more details)
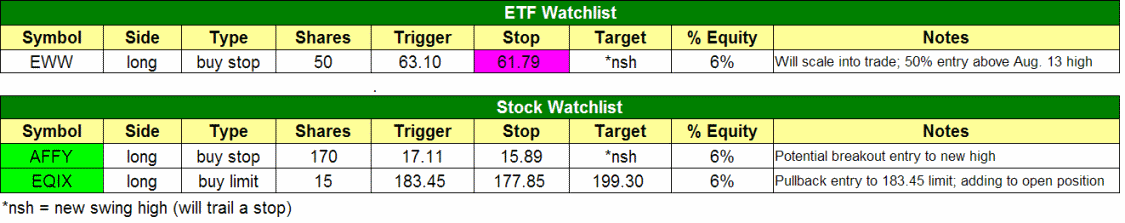
today’s watchlist (potential trade entries):
Having trouble seeing the open positions graphic above? Click here to view it directly on your web browser instead.
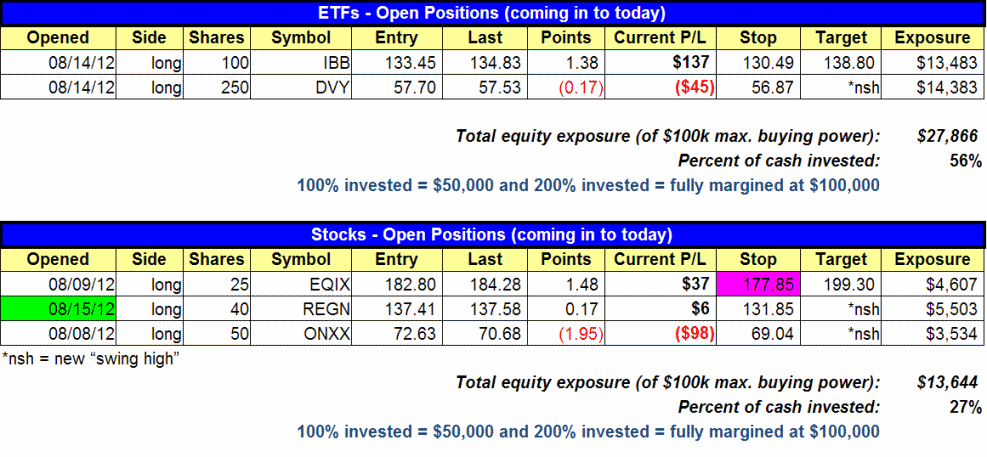
open positions:
Below is an overview of all open positions, as well as a report on all positions that were closed only since the previous day’s newsletter. Net P/L figures are based on two separate $50,000 model portfolios (one for ETFs and one for stocks). Changes to open positions since the previous report are listed in pink shaded cells below. Be sure to read the Wagner Daily subscriber guide for important, automatic rules on trade entries and exits.
Having trouble seeing the open positions graphic above? Click here to view it directly on your web browser instead.
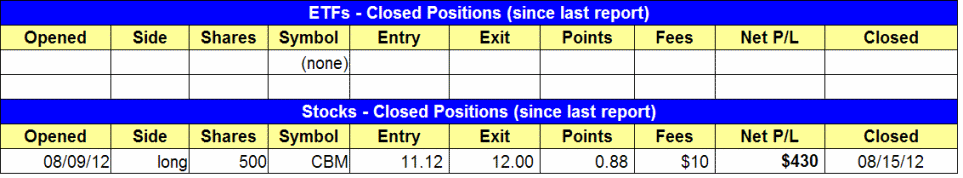
closed positions:
Having trouble seeing the closed positions graphic above? Click here to view it directly on your web browser instead.
ETF position notes:
- We remain long both IBB and DVY with no changes to stop or target prices. EWW remains on watchlist as well.
stock position notes:
- As discussed in yesterday’s comments, we followed our plan to sell CBM on yesterday’s open. This enabled us to net a solid 8% gain on a hold time of just 5 days. Although CBM may go higher from here, apathetic market conditions mean consolidation is likely first.
- EQIX acted well yesterday, as it broke out of the volatility contraction of its tight sideways range. On today’s stock watchlist, notice that we are planning to add to the EQIX position on a slight pullback (with buy limit order only). If the pullback does not hit our trigger price, we will simply hold the existing shares we have.
- REGN triggered for buy entry from yesterday’s watchlist.
ETF and broad market commentary:
Holding support of their previous day’s lows, stocks rebounded modestly yesterday, with the Dow being the only index to finish in negative territory. Stocks trended higher in the morning, then traded in a tight, sideways range throughout the rest of the day. This time, small and mid-cap stocks led the charge. The small-cap Russell 2000 Index ($RUT) and S&P Midcap 400 Index ($MID) rallied 0.9% and 0.6% respectively. The Nasdaq Composite Index ($COMPQ) rose 0.5%. The S&P 500 Index ($SPX) edged 0.1% higher, while the Dow Jones Industrial Average ($DJIA) was lower by the same percentage. Overall, it was another uneventful day with the exception that small and mid-cap stocks finally caught a bid. As we’ve been discussing over the past week, this is more important than it appears on the surface because the stock market has been lacking the critical leadership of small and mid-cap growth stocks.
Turnover was slightly lower across the board, preventing the Nasdaq from registering a bullish “accumulation day.” In the NYSE, total volume was 10% lighter than the previous day’s level. Trading in the Nasdaq eased 2%. It was the eighth straight day of lighter than average volume in the Nasdaq. As we have been mentioning for several weeks, such a light pace of trading is typical during the month of August. Although total volume was lighter than the previous day’s levels, the ADV/DEC volume ratio was positive in both the NYSE and Nasdaq, where advancing volume exceeded declining volume by ratios of approximately 1.7 to 1.
In the August 10 issue of The Wagner Daily, we pointed out the relative strength (daily chart) and potential breakout to a new all-time high (weekly chart) in iShares Mexico Index ($EWW). Over the next two days that followed, EWW drifted lower, then “undercut” near-term support of its 20-day exponential moving average yesterday morning (August 15), but rallied to settle 0.9% higher by the closing bell. This resulted in the formation of a bullish reversal candle that coincided with an “undercut” of an obvious level of support. These, as we frequently discuss, are the best types of pullback entries because the “undercuts” of support absorb overhead supply that enable the ETF to more easily move higher. Now, the ETF is just 21 cents below our trigger price for partial swing trade buy entry (above the high of August 13). On the daily chart below, notice how a rally above the high of the past three days also correlates to a breakout above the short-term downtrend line from the August 6 high:
")
Subscribers should note our exact share size, entry, and exit prices for the EWW swing trade setup on the ETF watchlist section of today’s newsletter. Note that the intial entry will only be on partial share size, with the remaining shares being added on a breakout above resistance to a new all-time high (above the $64.65 area). There are a few other ETFs on our radar screen for potential buy entry, but we are looking for pullback entries right now. If any of these ETFs near our potential trigger prices, we will be sure to highlight them here in the newsletter.
Our position in iShares Nasdaq Biotech Index ETF ($IBB) acted well yesterday, and is currently showing up on our preset technical stock screener as the top-ranked Potential Breakout entry (based on top RS rating). The ETF gained 0.9% and cleared horizontal price resistance of a recent “swing high” yesterday. With a little cooperation from the market, IBB should be well-positioned for a rally to test its all-time high that was set on July 27. Our other open ETF position, iShares Dow Dividend Index ($DVY) continues to hold in a tight range near its high.
stock commentary:
$AFFY has been added as a new watchlist candidate for potential swing trade buy entry today. The first chart below (daily time interval) illustrates the setup, while the second chart (monthly interval) shows that AFFY has also broken out above a 5-year downtrend line:
")
")
In addition to AFFY, we are also stalking EQIX for adding additional shares to our existing position.
If you are a new subscriber, please e-mail rick@morpheustrading.com?subject=subscriber%20question with any questions regarding our trading strategy, money management, or how to make the most out of this report.
relative strength combo watchlist:
Our Relative Strength Combo Watchlist makes it easy for subscribers to import data into their own scanning software, such as Tradestation, Interactive Brokers, and TC2000. This list is comprised of the strongest stocks (technically and fundamentally) in the market over the past six to 12 months. The scan is updated every Sunday, and this week’s RS Combo Watchlist can be downloaded by logging in to the Members Area of our web site.
NOTE: This week, the Relative Strength Combo Watchlist will not be updated until Wednesday evening (Aug. 15). In the meantime, you may still download the previous week’s watchlist because not much has changed since then.