today’s watchlist (potential trade entries):

open positions:
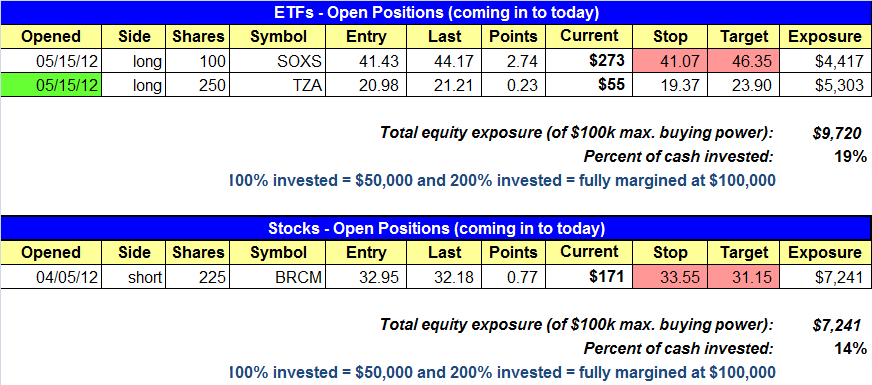
Below is an overview of all open positions, as well as a report on all positions that were closed only since the previous day’s newsletter. Net P/L figures are based on two separate $50,000 model portfolios (one for ETFs and one for stocks). Changes to open positions since the previous report are listed in a pink shaded cell below. New entries are shaded in green cells. Be sure to read the Wagner Daily subscriber guide for important, automatic rules on trade entries and exits.

Having trouble seeing the open positions graphic above? Click here to view it directly on your web browser instead.
closed positions:

Having trouble seeing the closed positions graphic above? Click here to view it directly on your web browser instead.
ETF position notes:
- TZA buy entry triggered.
stock position notes:
- BRCM short entry triggered.
ETF and broad market commentary:
Following an opening gap up, stocks went tumbling yesterday as trade expanded. For a second day in a row, the market gapped higher at the open. However, selling pressure came into the market at the morning reversal period in contrast to the late session selling we saw on Tuesday. All five major indices closed down and near session lows. Higher beta issues led the decline. The S&P MidCap 400 plunged 0.9% while both the small-cap Russell 2000 and the Nasdaq slid 0.7%. The S&P 500 closed down by 0.4%. The Dow Jones Industrial Average put in the best performance on the day, as it contained losses to a modest 0.3%.
Market internals were bearish for a second consecutive day. Volume increased on the Nasdaq by 7.2% and ont he NYSE by a modest 0.4%. Declining volume topped advancing volume by a ratio of 2.5 to 1 on the NYSE and 2.1 to 1 on the Nasdaq. As a result of Wednesday’s bearish internals, we would categorize the day as a distribution day on both exchanges.
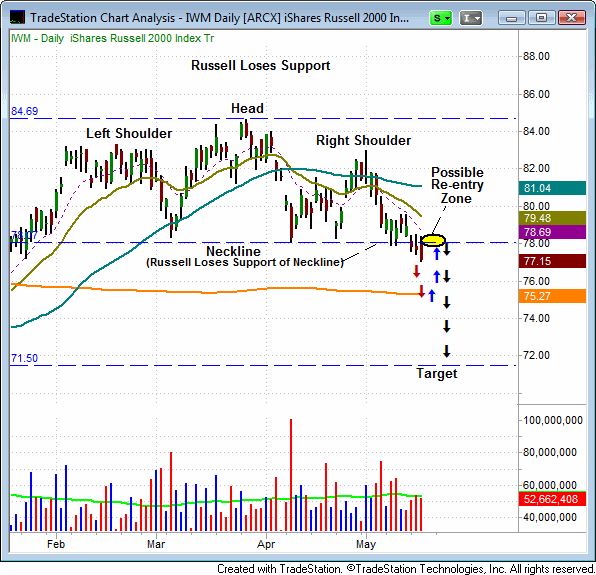
In the May 9th and 14th editions of the Wagner daily we discussed the head and shoulders pattern that was forming on the small-cap Russell 2000. In the May 9th newsletter we stated, “if the Russell 2000 loses support of the neckline at 785, then the predicted selloff would be to 720. We will be monitoring the Russell carefully, as its next test of the 785 mark could result in the loss of support and a significant move lower”. On May 14th we commented that, “(a move by IWM) below Friday’s low of $78.42 could result in a break of the neckline of the head and shoulders pattern. A drop below this key market would likely result in a quick move to the 200-day MA for IWM. Yesterday, IWM did in fact breach its neckline and now appears headed for the 200-day MA. In all likelihood, IWM will find support at its 200-day MA. Typically, when a neckline of a head and shoulders pattern is broken, a subsequent bounce will occur back up into resistance near the neckline. This bounce generally results in another shorting opportunity.

Although it saw a shaky start, our open position in SOXS rallied strongly yesterday and we are now up over 6% in this trade. TZA hit its trigger yesterday and we are now long this ETF. TZA also performed well yesterday. RTH remains on the watchlist and appears likely to trigger tomorrow. As long as volume continues to rise, we expect to see further selling pressure in the market. Yesterday’s higher volume suggests we should see another drop in the market tomorrow.
stock commentary:
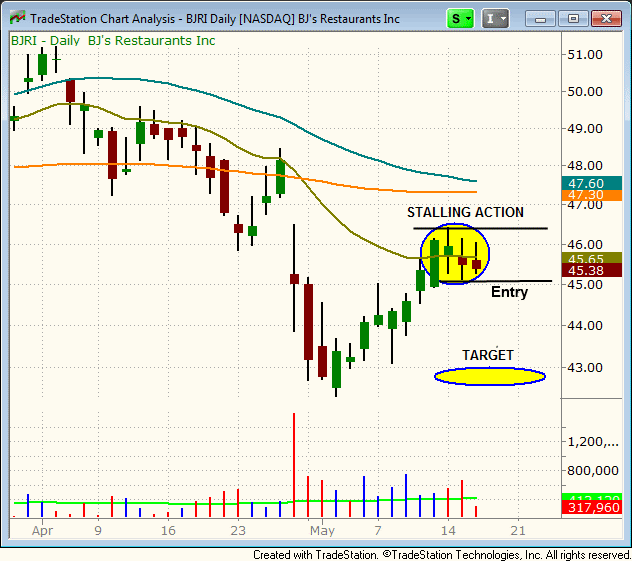
The BRCM short entry triggerd yesterday and followed through nicely to the downside on higher volume. We are placing BJRI on the watchlist today due to the stalling action at the 20-day EMA the past few days.

If you are a new subscriber, please e-mail [email protected] with any questions regarding our trading strategy, money management, or how to make the most out of this report.