Current signal generated on close of November 13.
Portfolio exposure can be anywhere from 25% to 50% long. If positions are holding up well, then one can add exposure beyond 50%.
Past signals:
- Neutral signal generated on close of November 6.
- Buy signal generated on close of September 9
- Neutral signal generated on close of August 15
- Buy signal generated on close of July 11
- Neutral signal generated on close of July 5
- Sell signal generated on close of June 24
today’s watchlist (potential trade entries):

Having trouble seeing the open positions graphic above? Click here to view it directly on your web browser instead.
open positions:
Below is an overview of all open positions, as well as a report on all positions that were closed only since the previous day’s newsletter. Changes to open positions since the previous report are listed in pink shaded cells below. Be sure to read the Wagner Daily subscriber guide for important, automatic rules on trade entries and exits.

Having trouble seeing the open positions graphic above? Click here to view it directly on your web browser instead.
closed positions:

Having trouble seeing the closed positions graphic above? Click here to view it directly on your web browser instead.
ETF position notes:
- No trades were made.
stock position notes:
- No trades were made.
ETF, stock, and broad market commentary:
This week’s holiday schedule:
- Wednesday Nov. 27 – Wednesday’s Q&A webinar is canceled.
- Thursday, Nov. 28 – Market is closed.
- Friday, Nov. 29 – Market closes early at 1 pm est.
- Due to Friday’s early close, we will publish an abbreviated version of the Wagner Daily on Thursday night. There will be no commentary, but we will update the watchlist, open, and closed position sections.
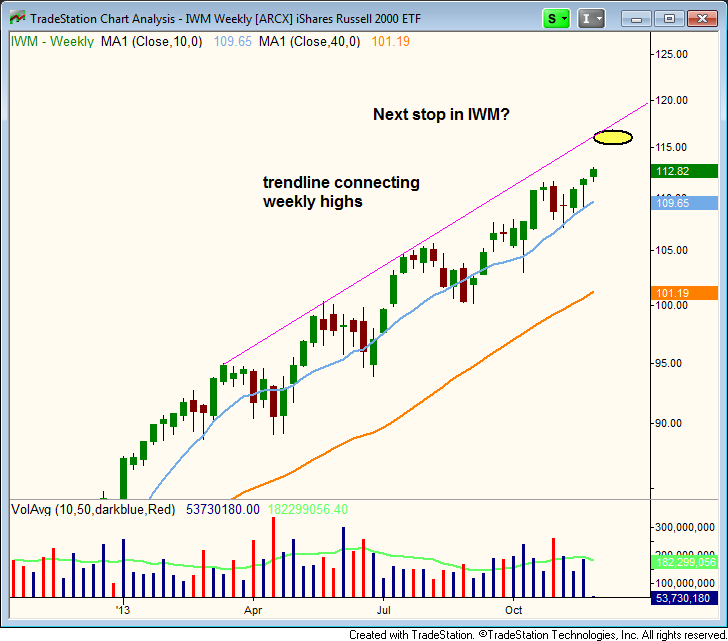
Leadership from the small cap index returned on Tuesday, with the Russell 2000 posting a 0.9% gain while the S&P 500 and Dow Jones were basically flat. The S&P 500 and Dow Jones have stalled out the past two sessions and may need a few days of rest before pushing higher.
With Tuesday’s advance, the Russell has now clearly broken out to new highs. Drawing a trendline connecting the weekly highs on a chart of the Russell 2000 ETF ($IWM), the next stop could be around $160.
After breaking out from 16-week base during the summer, iShares Core MSCI EAFE ETF ($IEFA) has been in trend mode, holding above the rising 10-week moving average. The current consolidation is a flat base type pattern, where the chart corrects more by time (sideways) than by price. We look for the action to hold above the 10-week MA and eventually break out to new highs.
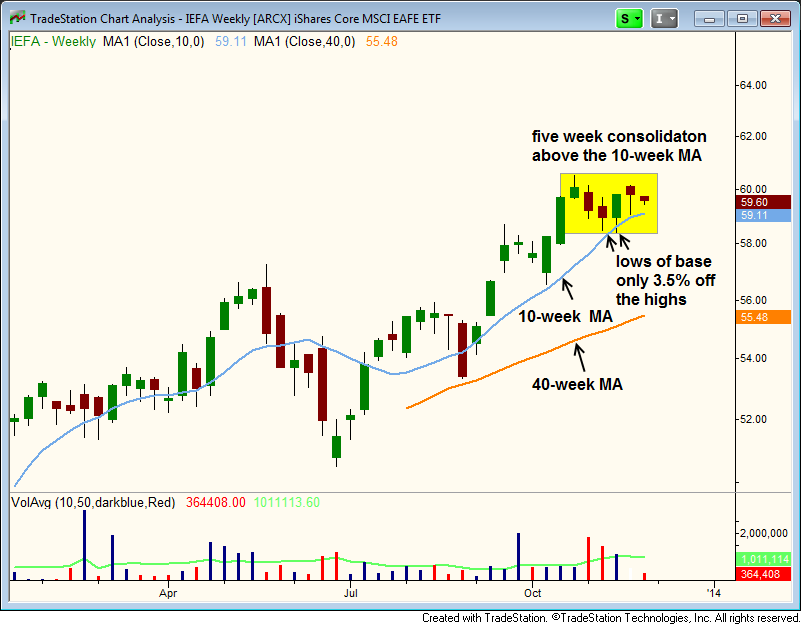
We like the action in $IEFA because it is in a clear uptrend with all the major averages pointing in the right direction.
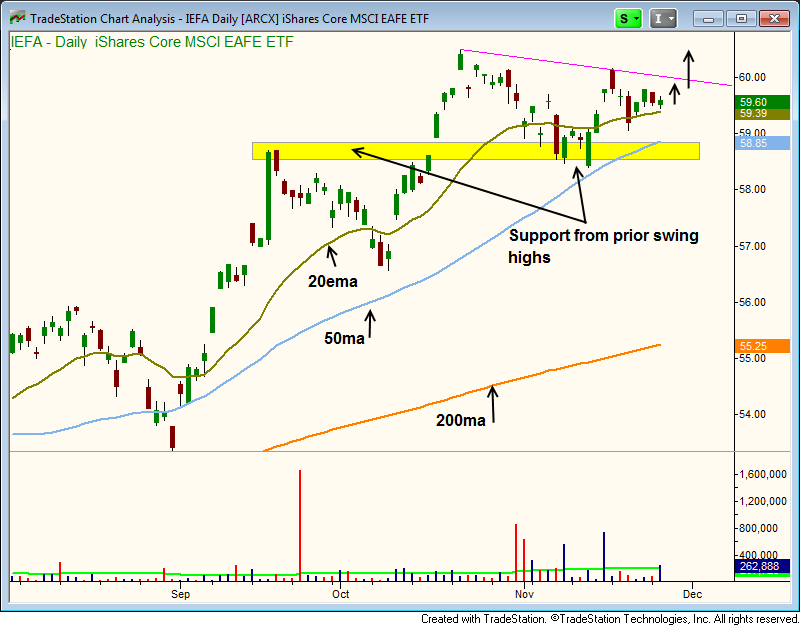
$IEFA held above the 50-day MA and prior swing high during the last pullback. A break above the downtrend line could spark a move to new highs, but if the price fails to push higher, then we could potentially see another slight pullback to $59. If there is a pullback, then we will closely monitor the action for an entry off a bullish reversal candle.
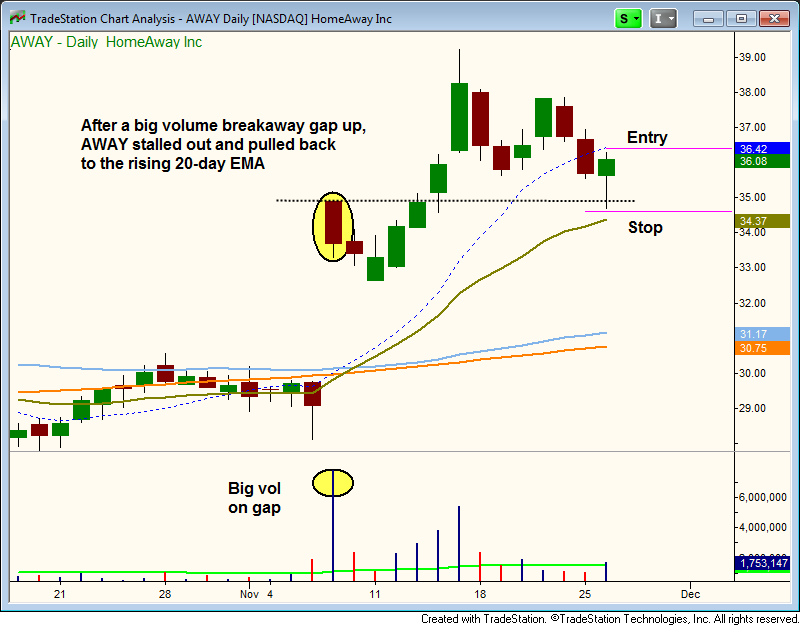
We have one new buy setup on today’s watchlist in $AWAY.
$AWAY exploded higher from an earnings gap up earlier this month (note the monster volume on the gap up). After stalling at $39, the action has pulled back in to the 20-day EMA the past two weeks.
The volume pattern has been quite bullish, with volume climbing during the rally and falling off during the pullback.
Our buy entry is over yesterday’s high with a stop beneath yesterday’s low. $AWAY has solid fundamentals with a composite ranking of 97, so it is an A rated stock for us. This setup is called “the combo”, where a stock has solid relative strength and very strong fundamentals.
Current signal generated on close of November 13.
Portfolio exposure can be anywhere from 25% to 50% long. If positions are holding up well, then one can add exposure beyond 50%.
Past signals:
- Neutral signal generated on close of November 6.
- Buy signal generated on close of September 9
- Neutral signal generated on close of August 15
- Buy signal generated on close of July 11
- Neutral signal generated on close of July 5
- Sell signal generated on close of June 24
today’s watchlist (potential trade entries):
Having trouble seeing the open positions graphic above? Click here to view it directly on your web browser instead.
open positions:
Below is an overview of all open positions, as well as a report on all positions that were closed only since the previous day’s newsletter. Changes to open positions since the previous report are listed in pink shaded cells below. Be sure to read the Wagner Daily subscriber guide for important, automatic rules on trade entries and exits.
Having trouble seeing the open positions graphic above? Click here to view it directly on your web browser instead.
closed positions:
Having trouble seeing the closed positions graphic above? Click here to view it directly on your web browser instead.
ETF position notes:
- No trades were made.
stock position notes:
- No trades were made.
ETF, stock, and broad market commentary:
This week’s holiday schedule:
- Wednesday Nov. 27 – Wednesday’s Q&A webinar is canceled.
- Thursday, Nov. 28 – Market is closed.
- Friday, Nov. 29 – Market closes early at 1 pm est.
- Due to Friday’s early close, we will publish an abbreviated version of the Wagner Daily on Thursday night. There will be no commentary, but we will update the watchlist, open, and closed position sections.
Leadership from the small cap index returned on Tuesday, with the Russell 2000 posting a 0.9% gain while the S&P 500 and Dow Jones were basically flat. The S&P 500 and Dow Jones have stalled out the past two sessions and may need a few days of rest before pushing higher.
With Tuesday’s advance, the Russell has now clearly broken out to new highs. Drawing a trendline connecting the weekly highs on a chart of the Russell 2000 ETF ($IWM), the next stop could be around $160.
After breaking out from 16-week base during the summer, iShares Core MSCI EAFE ETF ($IEFA) has been in trend mode, holding above the rising 10-week moving average. The current consolidation is a flat base type pattern, where the chart corrects more by time (sideways) than by price. We look for the action to hold above the 10-week MA and eventually break out to new highs.
We like the action in $IEFA because it is in a clear uptrend with all the major averages pointing in the right direction.
$IEFA held above the 50-day MA and prior swing high during the last pullback. A break above the downtrend line could spark a move to new highs, but if the price fails to push higher, then we could potentially see another slight pullback to $59. If there is a pullback, then we will closely monitor the action for an entry off a bullish reversal candle.
We have one new buy setup on today’s watchlist in $AWAY.
$AWAY exploded higher from an earnings gap up earlier this month (note the monster volume on the gap up). After stalling at $39, the action has pulled back in to the 20-day EMA the past two weeks.
The volume pattern has been quite bullish, with volume climbing during the rally and falling off during the pullback.
Our buy entry is over yesterday’s high with a stop beneath yesterday’s low. $AWAY has solid fundamentals with a composite ranking of 97, so it is an A rated stock for us. This setup is called “the combo”, where a stock has solid relative strength and very strong fundamentals.