market timing model:
Sell – Signal generated on the close of October 12 (click here for more details)
today’s watchlist (potential trade entries):
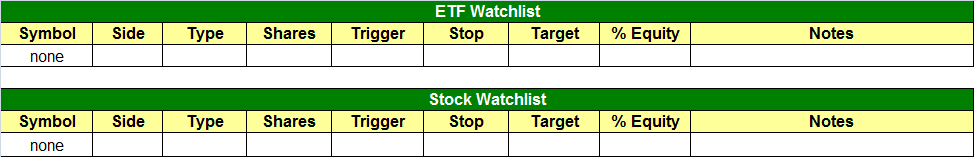
Having trouble seeing the open positions graphic above? Click here to view it directly on your web browser instead.
open positions:
Below is an overview of all open positions, as well as a report on all positions that were closed only since the previous day’s newsletter. Net P/L figures are based on two separate $50,000 model portfolios (one for ETFs and one for stocks). Changes to open positions since the previous report are listed in pink shaded cells below. Be sure to read the Wagner Daily subscriber guide for important, automatic rules on trade entries and exits.
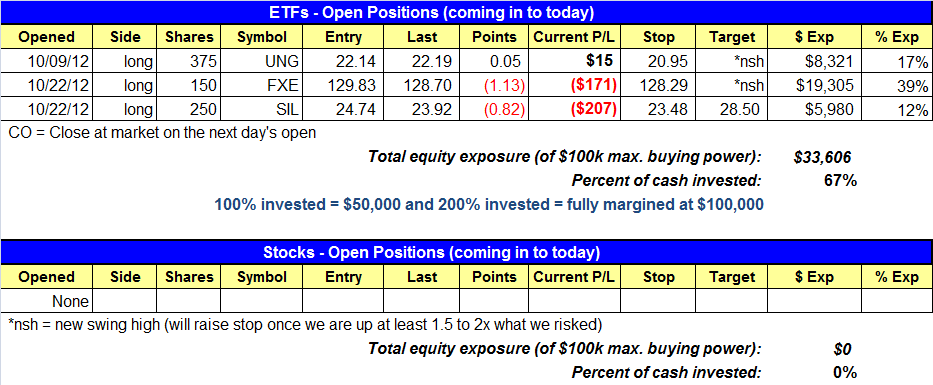
Having trouble seeing the open positions graphic above? Click here to view it directly on your web browser instead.
closed positions:
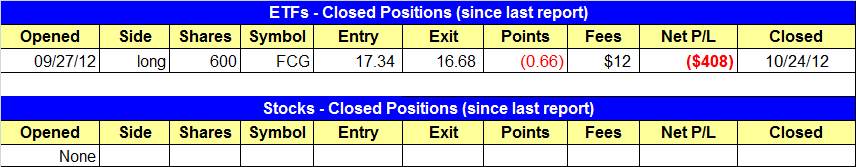
Having trouble seeing the closed positions graphic above? Click here to view it directly on your web browser instead.
ETF position notes:
- FCG sell stop triggered.
stock position notes:
- No trades were made.
ETF and broad market commentary:
Gapping to open near the previous day’s highs, the major indices got off to a positive start yesterday morning, but the bears quickly resumed control, causing stocks to erase early gains and drift lower throughout the day. The Dow Jones Industrial Average ($DJIA) slipped 0.2%, while the S&P 500 Index ($SPX), Nasdaq Composite ($COMPX), small-cap Russell 2000 Index ($RUT), and S&P Midcap 400 Index ($MID) each lost 0.3%. As is commonly the case in bearish market environments, all the main stock market indexes finished near their intraday lows.
Registering near yesterday’s levels, turnover was mixed. Total volume in the NYSE eased 3%, as turnover in the Nasdaq ticked 7% higher. In both exchanges, declining volume exceeded advancing volume by a ratio of less than 2 to 1, which was not overly bearish. However, the ADV/DEC volume ratios were positive before stock started selling off intraday.
In yesterday’s newsletter, we took an updated look at anticipated support and resistance levels of several of the broad-based ETFs. We then concluded our technical commentary by saying,”Now that the switch to an overall bearish sentiment has been confirmed, we are now patiently waiting for an eventual bounce in the broad market that will provide us with ideal, low-risk entry points on new short positions or inversely correlated ‘short’ ETFs.” This means our focus is now primarily on the short side of the market, as even ETFs with a low correlation to the direction of the stock market have started feeling the pinch of the overly bearish sentiment in the equities markets. However, patience to wait for the proper entry points is crucial because the ETFs with relative weakness that are on our radar screen as potential short sale candidates remain glued to their lows.
Because fear is a more powerful human emotion than greed, stocks and ETFs nearly always fall much faster and more violently than they rise. As such, there are key technical differences in our trading strategy with regard to the price levels where we look to sell short, compared to the ways in which we buy stocks and ETFs.
Presently, the vast majority of ETFs we are monitoring for potential short sale entry (or buy entry for inversely correlated “short ETFs”) have either set new “swing lows” within the past few days, or are trading too close to a prior low, to initiate a low-risk entry point at current levels. We do not sell short ETFs that are breaking down below obvious levels of support, as they tend to rebound and rip higher after just one to two days of weakness.
Our most ideal short selling candidates are ETFs that have recently set new “swing lows” (or are testing prior lows), and have subsequently bounced into resistance over a period of three to ten days. Right now, we are developing an internal watchlist of ETFs that may do so in the coming days. One such candidate is PowerShares QQQ Trust ($QQQ), which will likely bounce off major support of its 200-day moving average within the next day or two, but then stall when it encounters moving average resistance, as well as resistance of its new downtrending channel. This is shown on the daily chart of QQQ below:

Although we prefer to wait for a bounce off the lows before entering new short positions, it is important to realize we do not enter a new short sale while the ETF is still bouncing (trying to catch the high of the bounce). Rather, we first wait for subsequent confirmation that the ETF is about to stall again. This typically comes in the form of either a bearish reversal bar (such as a bearish engulfing or hanging man candlestick pattern) or sharp opening gap down, which signals the short-term bounce is losing steam. Similarly, we take the same approach on the long side when buying pullbacks of uptrending stocks; we always wait for a pullback to form some sort of reversal pattern before buying (rather than trying to catch the bottom of the pullback).
Disappointingly, our position in FirstTrust Natural Gas Index ($FCG) hit its protective stop yesterday. Less than one week ago, the ETF was still showing great relative strength to the broad market, and had even broken out above resistance of a multi-week trading range. However, the breakout failed, causing FCG to steadily slide lower for four straight days. In hindsight, we could have made a judgment call to least tighten our stop to breakeven after FCG broke out, due to overall poor market conditions. However, we usually do not raise our stops until a trade is in the money by a margin of approximately double the initial risk (2 to 1 reward-risk ratio). Regardless, we definitely are happy to be out of the trade now because it has broken below major support of its 200-day moving average, as well as its prior low from late September.
stock commentary:
There isn’t much out there in the way of low-risk short setups right now. We are monitoring $CHKP for a potential short entry but the setup needs a few more days to provide us with an ideal entry point:

A breakaway gap down from a negative reaction to earnings broke a four month support level at 44.00 on October 17. If $CHKP can take out the 10/17 high then it should see some short covering, as most traders would not have expected the price action to climb back to that level. The 20-day EMA is also above to lend a little more resistance. This setup is not official.
Throughout the summer, the major media sites were focused on the European crisis and the potential for the US market to sell off sharply. By late summer no one was talking about the potential for a significant market rally, which allowed the market to bottom out and move higher. However, the move out was a three month rally that was probably the weakest advance in terms of big winners during the past four years. Over the past few weeks, big time Nasdaq market leaders have fallen apart with the Nasdaq Composite breaking down sharply below the 50-day MA, yet investors can only think about buying the dip. The fact that so few are worried about the market potentially heading much lower is concerning.
If you are a new subscriber, please e-mail [email protected] with any questions regarding our trading strategy, money management, or how to make the most out of this report.
relative strength combo watchlist:
Our Relative Strength Combo Watchlist makes it easy for subscribers to import data into their own scanning software, such as Tradestation, Interactive Brokers, and TC2000. This list is comprised of the strongest stocks (technically and fundamentally) in the market over the past six to 12 months. The scan is updated every Sunday, and this week’s RS Combo Watchlist can be downloaded by logging in to the Members Area of our web site.