Current signal generated on close of July 11
Past signals:
- Neutral signal generated on close of July 5
- Sell signal generated on close of June 24
today’s watchlist (potential trade entries):

Having trouble seeing the open positions graphic above? Click here to view it directly on your web browser instead.
open positions:
Below is an overview of all open positions, as well as a report on all positions that were closed only since the previous day’s newsletter. Net P/L figures are based a $100,000 model portfolio. Changes to open positions since the previous report are listed in pink shaded cells below. Be sure to read the Wagner Daily subscriber guide for important, automatic rules on trade entries and exits.

Having trouble seeing the open positions graphic above? Click here to view it directly on your web browser instead.
closed positions:

Having trouble seeing the closed positions graphic above? Click here to view it directly on your web browser instead.
ETF position notes:
- No trades were made.
stock position notes:
- Bought $PDFS, $AMBA, and $WDAY. Sold half of $AWAY on the open for a small gain.
ETF, stock, and broad market commentary:
Stocks surged higher across the board, with all major averages gaining at least 1.0% on the session. The NASDAQ Composite rallied 1.6% on an 11% increase in volume, which produced a bullish follow through day. A follow through day occurs whenever the S&P 500 or NASDAQ rallies about 1.5% on higher volume. We would also label yesterday’s price and volume action in the S&P 500 as a follow through day, as the index rallied 1.4% on a 15% jump in volume.
Thursday’s follow through in the NASDAQ and S&P has generated a mechanical buy signal in our timing model. This signal allows us to be fully invested on the long side, provided that there are bullish patterns to buy. We are already 50% invested on the long side, and expect to add more exposure over the next few weeks as new setups develop.
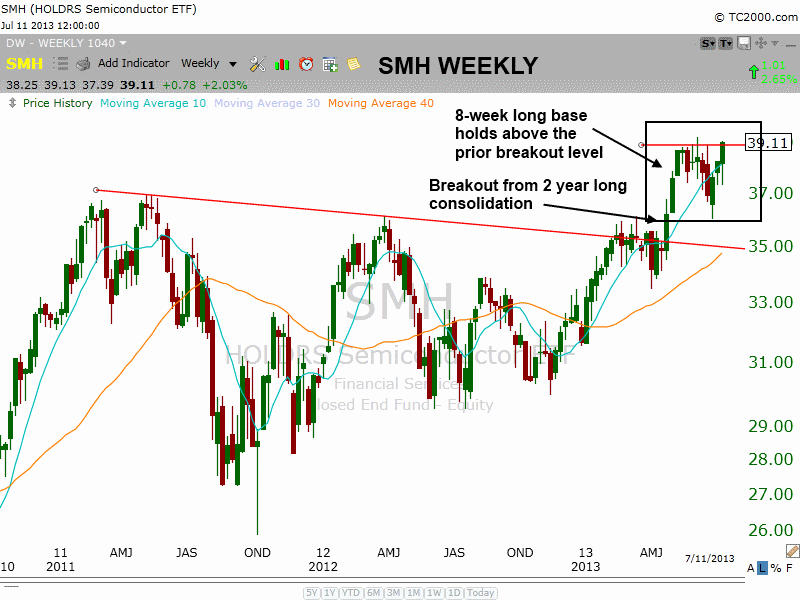
Merrill Lynch Semiconductors HOLDRS ($SMH) hit a new closing high for the year on the daily chart yesterday, and if it can close above 39.28 tomorrow, then it will also have broken out from an 8-week consolidation at the highs. The current 8-week base has held above the highs of the last base, which was two years long. Usually when a stock or ETF breaks out from a long base, the first correction after a big breakout is shorter in time and much more shallow (which is exactly what $SMH has done on the chart below).

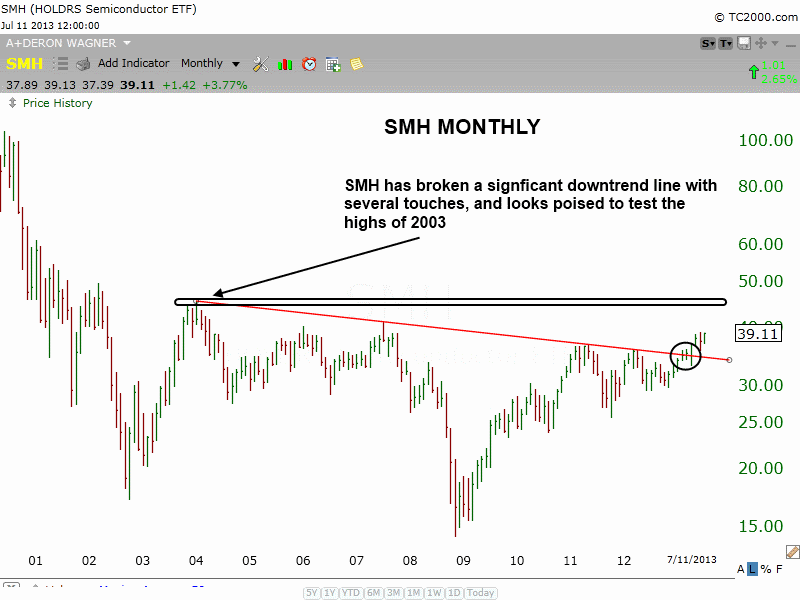
On the monthly chart, $SMH has recently broken a significant downtrend line, and if momentum continues to build, then it should eventually reach the highs of 2003, around $45-46. We are monitoring the action for a confirmed breakout, and will let you know if/when we decide to officially enter the trade.

On the stock side, $PDFS, $AMBA, and $WWAY buy entries triggered. Although $WDAY failed to hold the breakout level in the afternoon, if it can close above the 10-week MA on the weekly chart (about $65), then we will probably see some follow through to the upside next week, as the price action is pretty tight. We sold 100 shares of $AWAY on the open for a small gain. We have 100 shares left with a tight stop beneath Thursday’s low.
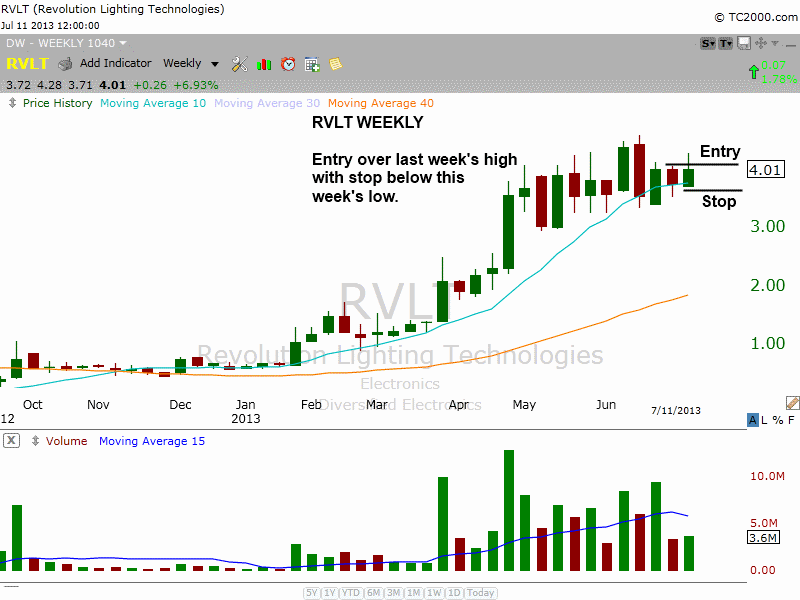
We have one new buy setup on today’s watchlist in $RVLT. $RVLT has a 99 relative strength ranking, and is the strongest stock in its group (32 stocks). Although it only trades at $4 per share, it trades well over 1 million shares a day. Our entry is simply over last week’s high. The stop is beneath this week’s low, which is just below the 10-week MA. We reduced our share size, as this is not an A rated setup (it lacks fundamentals, but has great relative strength/technicals).

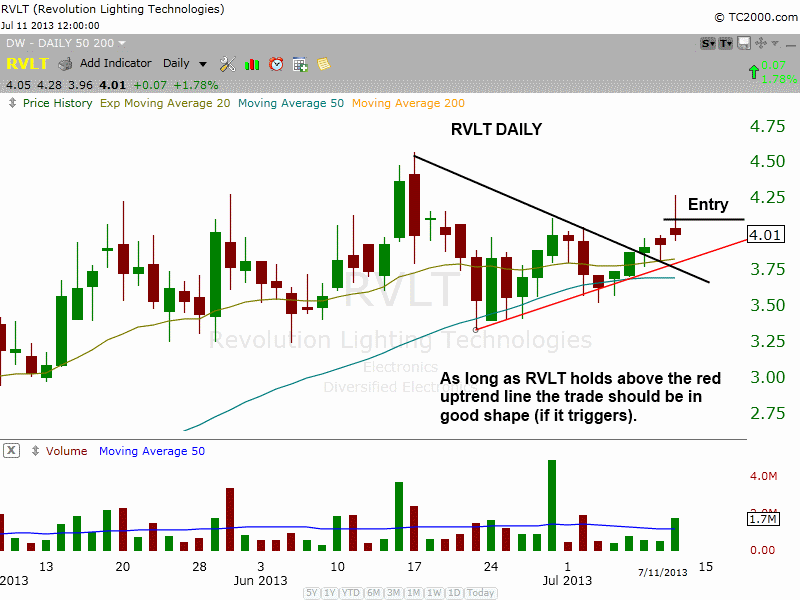
The daily chart below shows that $RVLT stalled at the two week high and pulled back in. We like $RVLT for an entry if it can climb back above last week’s high. If the setup triggers, we expect the price action to hold above the 20-day EMA and the short-term, red uptrend line.
