Buy
– Signal generated on the close of April 30
Due to the recent distribution in the Nasdaq, we are no longer in confirmed buy mode (now is not the time to step on the gas). We remain in buy mode, but if market conditions continue to deteriorate the timing model will shift to sell mode.
today’s watchlist (potential trade entries):

Having trouble seeing the open positions graphic above? Click here to view it directly on your web browser instead.
open positions:
Below is an overview of all open positions, as well as a report on all positions that were closed only since the previous day’s newsletter. Net P/L figures are based a $100,000 model portfolio. Changes to open positions since the previous report are listed in pink shaded cells below. Be sure to read the Wagner Daily subscriber guide for important, automatic rules on trade entries and exits.

Having trouble seeing the open positions graphic above? Click here to view it directly on your web browser instead.
closed positions:

Having trouble seeing the closed positions graphic above? Click here to view it directly on your web browser instead.
ETF position notes:
- No trades were made.
stock position notes:
- No trades were made.
ETF, stock, and broad market commentary:
After two days of solid gains, the major averages chopped around in a tight range all day on light volume. Most averages closed in the -0.1% to +0.1% range, except for the small cap Russell 2000, which showed a bit of relative strength at +0.5%. The current bounce in the S&P 500 has retraced about half of the prior decline before stalling out at the 20-day simple moving average on Monday.
The volume pattern in the NYSE and NASDAQ remains bearish, as we have yet to see any heavy volume accumulation days the past few weeks. Because of this, we would not be surprised to see the market eventually test the prior swing low and continue to stay range bound for another week or two.
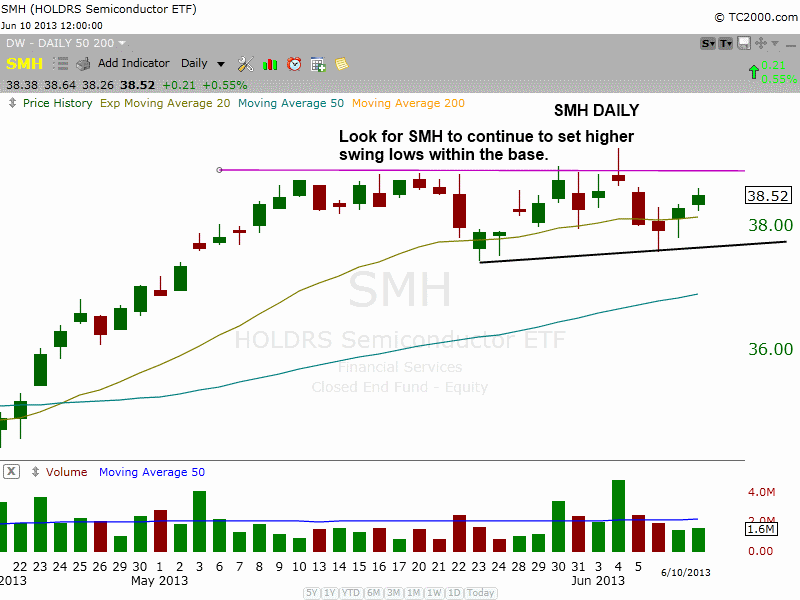
Like the broad based averages, Merrill Lynch Semiconductors HOLDRS ($SMH) may also need more time to consolidate before resuming the uptrend. The price action found support at the 20-day EMA after a false breakout and could possibly make its way back to the range highs by the end of the week.

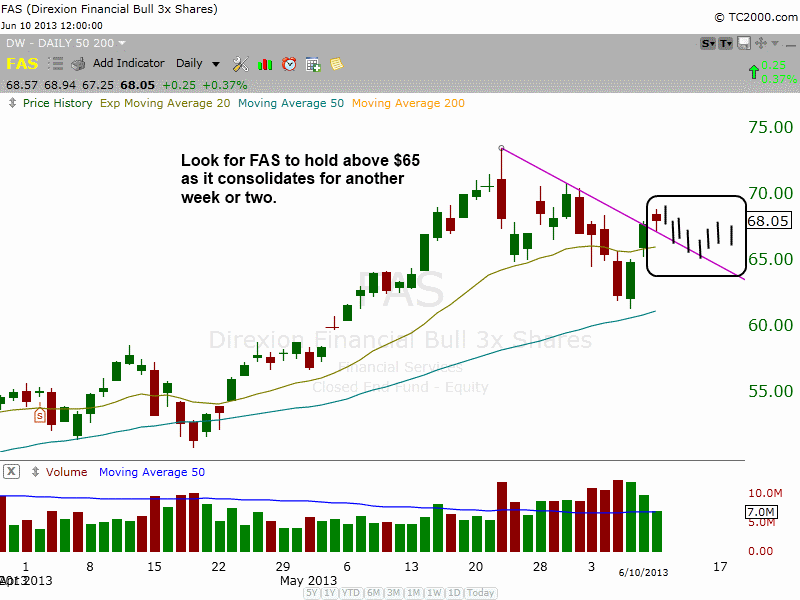
Direxion Daily Financial Bull 3X Shares ($FAS) bounced just shy of the 50-day MA last week. If $FAS continues to hold the $65 level, then we could see a low risk buy point emerge within the next week or two. Note the price action in the box on the chart below, which shows how the pattern could play out over the next 5-10 days.

We are basically looking for $FAS to form a higher swing low within the base to signal that the correction is potentially over.
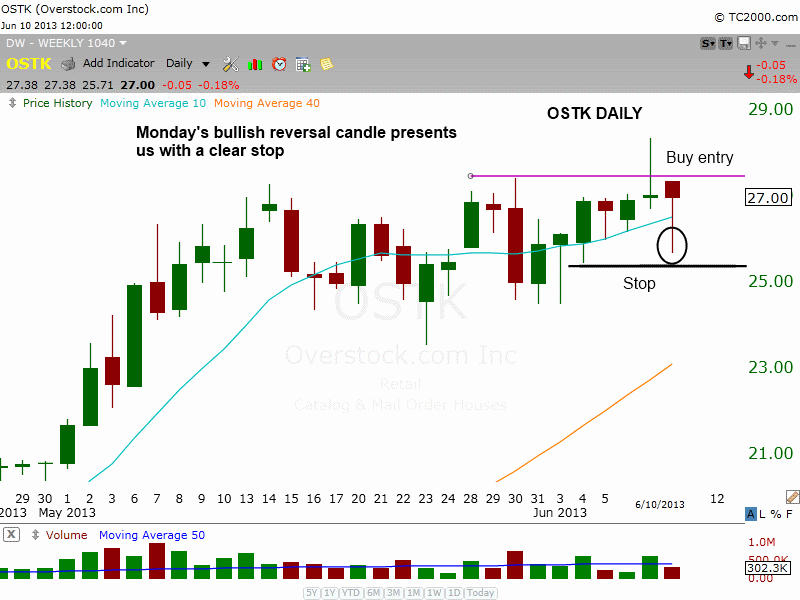
Although our $OSTK buy setup did not trigger yesterday, the price action was bullish. Note the bullish reversal candle that formed after a sharp selloff in the early morning.

The bullish reversal candle now gives us a clear exit point, as the price action should not return back below Monday’s low if our entry is triggered (bullish reversal candles should hold up….if not the pattern needs more time to develop).
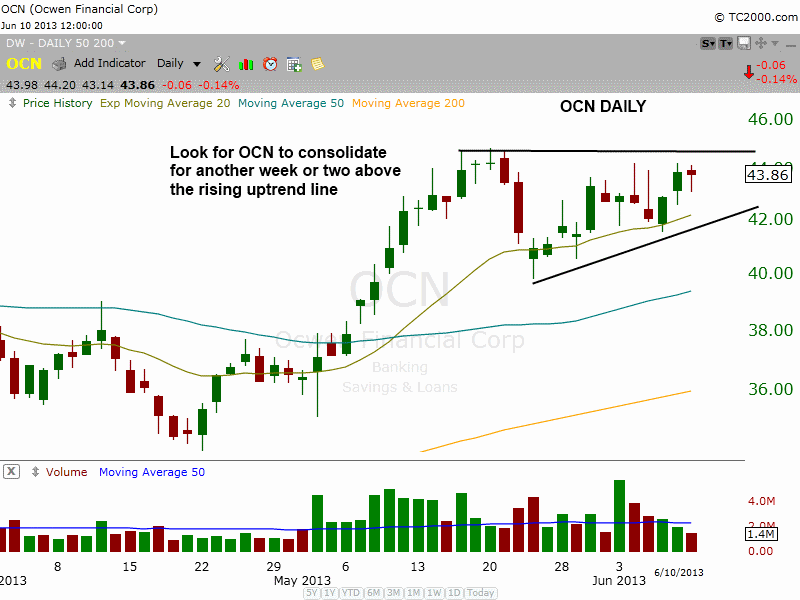
Ocwen Financial Corp. – ($OCN) has formed a tight base over the past few weeks after failing to break out to new highs. The strong move off the 50-day MA in May was confirmed by heavy volume. We’d like to see the price action test the 20-day EMA one more time before taking off to provide us with a low risk entry point. However, if $OCN runs to new highs this week without pulling back, then we could possibly see a false breakout with a 2-3 bar shakeout. That shakeout could present us with a low risk entry as well.
