market timing model: BUY
Current signal generated on close of November 13.
Portfolio exposure can be anywhere from 50 to 100% long. If positions are holding up well, then one can add exposure beyond 100%.
Past signals:
- Neutral signal generated on close of November 6.
- Buy signal generated on close of September 9
- Neutral signal generated on close of August 15
- Buy signal generated on close of July 11
- Neutral signal generated on close of July 5
- Sell signal generated on close of June 24
today’s watchlist (potential trade entries):

Having trouble seeing the open positions graphic above? Click here to view it directly on your web browser instead.
open positions:
Below is an overview of all open positions, as well as a report on all positions that were closed only since the previous day’s newsletter. Changes to open positions since the previous report are listed in pink shaded cells below. Be sure to read the Wagner Daily subscriber guide for important, automatic rules on trade entries and exits.

Having trouble seeing the open positions graphic above? Click here to view it directly on your web browser instead.
closed positions:
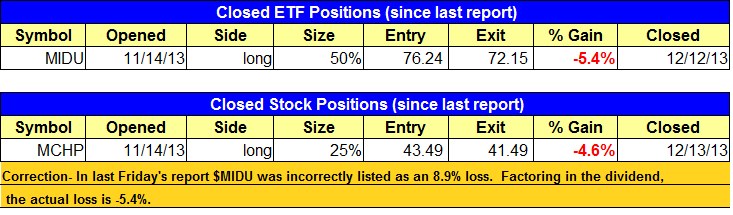
Having trouble seeing the closed positions graphic above? Click here to view it directly on your web browser instead.
ETF position notes:
- No trades were made. Please note the changes to today’s buy watchlist.
stock position notes:
- Entry #1 on SYNA triggered. Canceled the $CREG setup for now. We will wait for some sort of reversal bar to form.
ETF, stock, and broad market commentary:
For the second day in row, stocks chopped around in a narrow range, unable to bounce much from the close of last Wednesday’s distribution day. Since there wasn’t much buying interest late last week, the market could see further selling this week, with the S&P 500 potentially pulling back into the 50-day moving average.
The S&P 500 has lost the 20-day EMA, but there is still decent support from the prior swing low and 50-day MA around the 1,750 – 1,770 area.
The Mid-cap S&P 400 and Russell 2000 are trying to hold the 50-day moving average. Both averages are still trading above the prior swing low from November 7, so the uptrend remains intact.
In terms of moving averages, the NASDAQ Composite is the strongest index, as it’s still trading at the 20-day EMA, well above the 50-day MA and the prior swing low at 3,850.
It has really been a mix bag in terms of stock performance the past two weeks. Some stocks have pushed to new highs while others have struggled to hold obvious support levels. Last week’s distribution day put quite a dent into the current rally, and further distribution this week could force our timing model into neutral mode.
Our weekend scans produced a few ETFs that are consolidating in bullish fashion, such as Guggenheim Shipping ETF ($SEA). $SEA is currently consolidating in a tight range near 52-week highs after a 20% rally off the 40-week MA in late June.
$SEA looks to be forming a bull flag type pattern on the weekly chart. The rally was 12 weeks long, and so far the consolidation is 12 weeks (nice time symmetry). The consolidation has retraced only 33% of the advance, which is a bullish sign. A bull flag pattern really shouldn’t retrace much more than 33% of the prior advance, with 38% being the max.
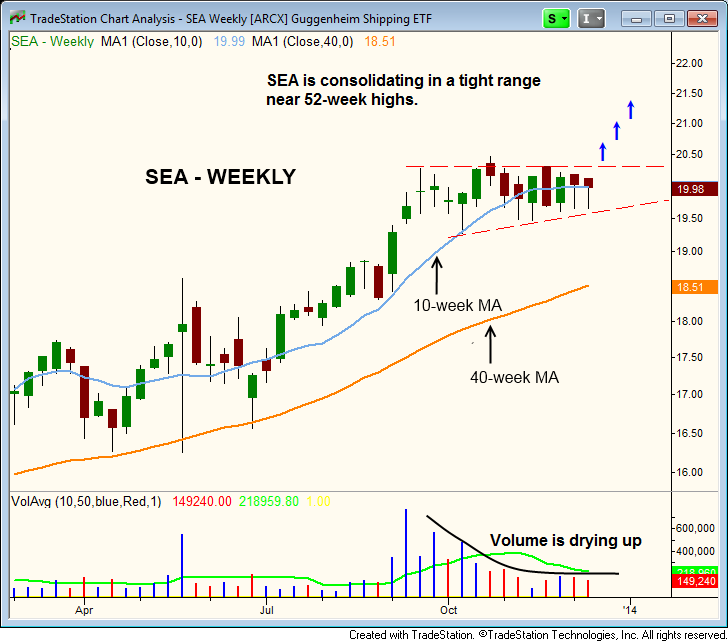
The price action is currently oscillating around the 10-week MA, with last week’s candle forming an inside week, which occurs when the current week’s price range falls within the price range of the previous week. It basically shows a tightening of the price action within the base (a bullish sign).
We are monitoring $SEA for a potential buy entry this week, but for now it is not an official setup.
On the stock side, $SYNA triggered a buy entry for the first half of the position. Entry #2 remains a live order.
$MCHP stopped us out on Friday and closed below the 50-day MA. We will continue to monitor the action for a potential re-entry point if the action can hold around the 50-day MA.
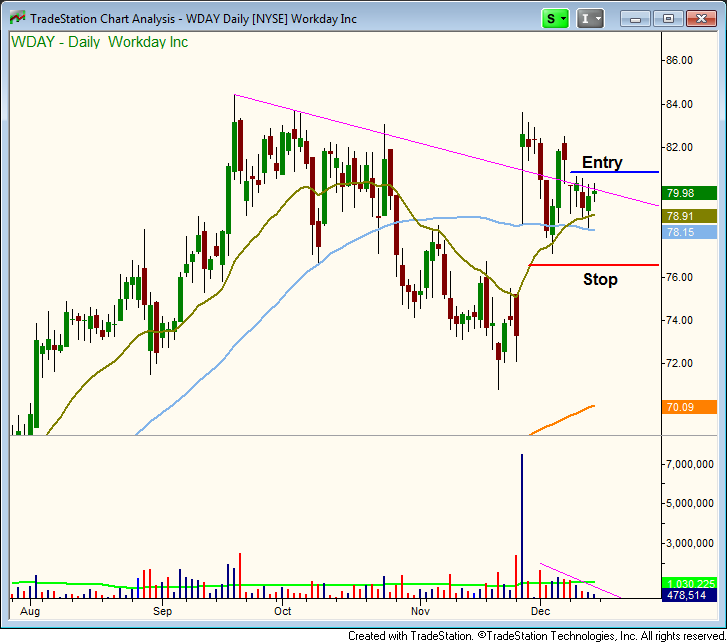
We have one new buy setup on today’s watchlist. For those who are still looking for some long exposure, we are monitoring $WDAY as a potential “dirty” downtrend line breakout. A dirty downtrend line is one that is drawn with candles probing above the line.
After the 11/26 gap up on big volume, $WDAY settled into a tight trading range last week, just above support of the 20 and 50-day MAs.
We are placing $WDAY on the official buy watchlist. Last week’s inside week presents us with a low risk entry point over the high of last week’s candle. The stop is placed beneath the recent swing low, minus some wiggle room.