Buy Mode
– Timing model generated buy signal on close of March 5 (click here for more details)
today’s watchlist (potential trade entries):

Having trouble seeing the open positions graphic above? Click here to view it directly on your web browser instead.
open positions:
Below is an overview of all open positions, as well as a report on all positions that were closed only since the previous day’s newsletter. Net P/L figures are based on two separate $50,000 model portfolios (one for ETFs and one for stocks). Changes to open positions since the previous report are listed in pink shaded cells below. Be sure to read the Wagner Daily subscriber guide for important, automatic rules on trade entries and exits.
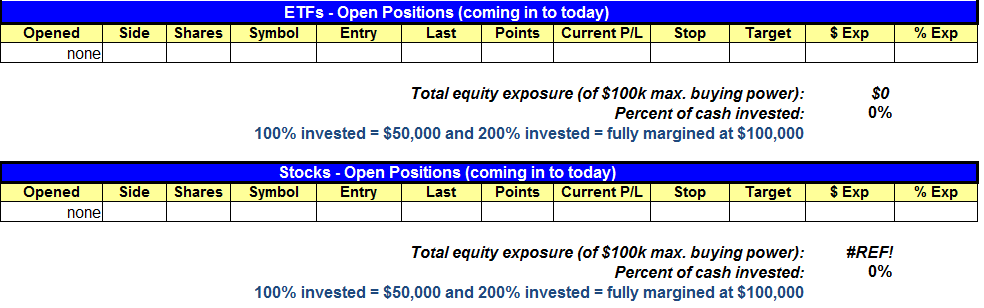
Having trouble seeing the open positions graphic above? Click here to view it directly on your web browser instead.
closed positions:
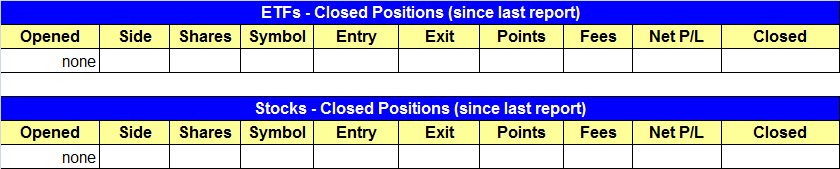
Having trouble seeing the closed positions graphic above? Click here to view it directly on your web browser instead.
ETF position notes:
- No trades were made.
stock position notes:
- $BX setup did not trigger due to 5-minute rule and is canceled. If you are long you can hold the position unofficially with the same stop we listed last Friday. The setup hasn’t changed and is still valid.
ETF, stock, and broad market commentary:
After gapping higher on the open, stocks drifted back down in the first 30 minutes trading, but the bulls stepped back in and the broad market edged its way back into positive territory by the closing bell. The major indices finished 0.4% 0.5% higher last Friday, on mixed volume that was nearly the same as the previous day’s levels.
With our stock and ETF swing trading strategy (click here for an overview), there are three main types of trade setups we take: breakouts above consolidation, pullbacks to near-term support (in uptrending stocks), and trend reversals. In healthy markets, we primarily focus on buying breakouts and pullbacks. However, we occasionally spot low-risk trend reversal setups, which often offer a very positive reward to risk ratio.
There are two new “official” ETF swing trade setups we are targeting for potential buy entry going into today’s session, both of which are trend reversal plays. The first is ProShares UltraShort 20+ Year Treasury Bond ETF ($TBT). The technical criteria for this setup is detailed on the weekly chart below:

Buying a trend reversal does NOT mean “bottom fishing,” which is akin to catching a falling knife. Rather, the stock or ETF must first indicate a high likelihood that a significant bottom has already been formed. For this, we specifically look for the stock or ETF to both trade in a sideways consolidation pattern for at least several months. More importantly, it must also form at least one “higher low” within that consolidation period (two is preferable).
Additionally, we always make sure the 10-week moving average (same as the 50-day moving average) has crossed above the 40-week moving average (same as 200-day moving average), which confirms the bearish momentum has reversed. Then, we buy the stock or ETF when it breaks out above the highs of its consolidation (horizontal price resistance).
As you can see on the chart above, $TBT meets all of these qualifications for a trend reversal play. The ETF has been consolidating in a sideways range since June 2012, and has formed two “higher lows” since then (November 2012 and February 2013). Then, after four weeks of tight consolidation near the high of its range, the ETF “undercut” support of its 10-week moving average just two weeks ago, but zoomed right back up to close at the highs of its range last week. Such price action is bullish and often precedes major breakouts.
As listed on today’s watchlist, we are simply planning to buy $TBT on a rally above last week’s high, which would also correlate to a breakout above key horizontal price resistance. Our protective stop loss is below support of the two-week low, as the price action should definitely not return below that level after the ETF breaks out above the highs of its range.
Unlike the majority of our swing trade setups, in which the holding period is usually intended to be around two or three weeks, note that this trade is intended to be an intermediate-term position. This means we intend to hold the ETF for one to three months (assuming the price action remains healthy). Throughout that period, our plan is to trail a protective stop higher, in order to lock in profits along the way. So, for those of you that like longer holding periods than what you been experiencing lately, this may be an ideal trade setup for you.
The second ETF trend reversal setup we are stalking for potential buy entry today is Guggenheim Solar ETF ($TAN). Like $TBT, this ETF meets the same trend reversal requirements on its weekly chart interval. However, it’s actually the daily chart pattern that makes this trade setup enticing. Take a look at the chart below:

In mid-February, $TAN attempted to break out above a five-week base of price consolidation (point “A”). However, the breakout failed, causing the ETF to fall back to the lows of its range (point “B”) less than two weeks later.
If you are new to trading, you may understandably assume failed breakouts are a bad thing. But the reality is that failed breakouts that hold support of the prior range often lead to some of the most explosive breakouts on the second breakout attempt. Since many traders buy the initial breakout attempt, then quickly sell when the breakout fails, it has the effect of absorbing overhead supply. In turn, this makes it easier for the stock or ETF to zoom higher on its next move up.
In the case of $TAN, we like that the ETF firmly found support at the lows of its prior range, which has conveniently converged with major support of its 200-day moving average (orange line). With this swing trade setup, our trigger for buy entry is just above the two-day high, while the protective stop price is below the lows of the range. If this ETF triggers for buy entry, bullish momentum should cause it to surge above last month’s high shortly thereafter. Again, please note the exact trade details on today’s watchlist.
On the stock side, we have three new official long setups in $NTE, $HCA, and $BC. $BC has formed a tight-six week base on the weekly chart. Looking at the daily chart below, we see a nice reversal bar on higher volume last Friday, which is our buy signal. We plan to establish half size above the two-day high and add to the position on a breakout or earlier (if a low risk entry point develops).

$BX did not officially trigger a long entry last Friday using our 5-minute rule. The 5-minute rule prevents us from entering any setup that triggers within the first five minutes of trading to avoid false triggers. $BX traded more than 1.3% above our entry on the open, so the setup was officially canceled. The trade still looks good, but with the higher entry point we are simply going to pass on the setup in favor of the three new entries on the watchlist.
If the market is headed significantly higher, then recent breakouts should hold with new breakouts emerging over the next few weeks. Overall, the charts are holding up, so we must go long. As we have said in the past, it is ok to be wrong but not ok to stay wrong.
relative strength combo watchlist:
Our Relative Strength Combo Watchlist makes it easy for subscribers to import data into their own scanning software, such as Tradestation, Interactive Brokers, and TC2000. This list is comprised of the strongest stocks (technically and fundamentally) in the market over the past six to 12 months. The scan is updated every Sunday, and this week’s RS Combo Watchlist can be downloaded by logging in to the Members Area of our web site.