Current signal generated on close of August 15.
Portfolio long exposure can be anywhere from 30%-50% if you just joined the letter, or up to 100% (if your stocks are holding up).
Past signals:
- Buy signal generated on close of July 11
- Neutral signal generated on close of July 5
- Sell signal generated on close of June 24
today’s watchlist (potential trade entries):

Having trouble seeing the open positions graphic above? Click here to view it directly on your web browser instead.
open positions:
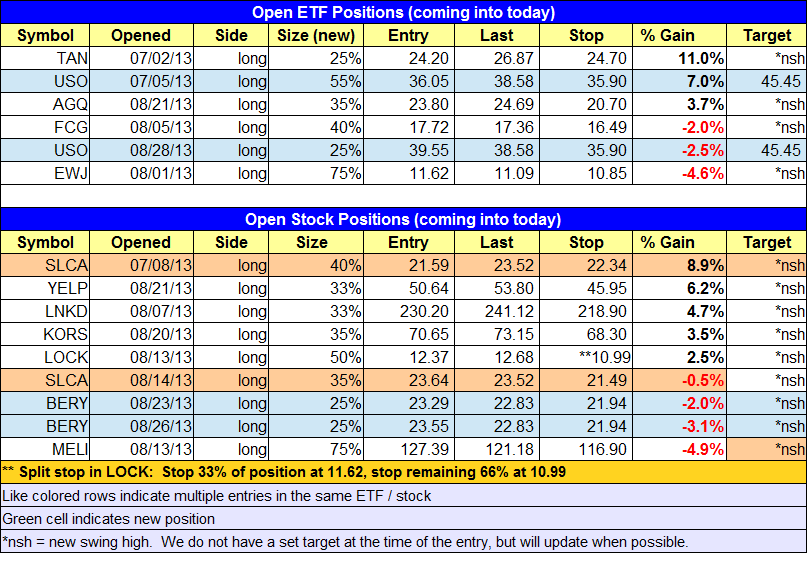
Below is an overview of all open positions, as well as a report on all positions that were closed only since the previous day’s newsletter. Changes to open positions since the previous report are listed in pink shaded cells below. Be sure to read the Wagner Daily subscriber guide for important, automatic rules on trade entries and exits. Click here to learn the best way to calculate your share size.

Having trouble seeing the open positions graphic above? Click here to view it directly on your web browser instead.
closed positions:

Having trouble seeing the closed positions graphic above? Click here to view it directly on your web browser instead.
ETF position notes:
- No trades were made.
stock position notes:
- No trades were made.
ETF, stock, and broad market commentary:
Stocks rallied during the first 90-minutes of trading, but for the second day in a row, lacked any follow through in the afternoon. However, unlike yesterday, stocks (in the NASDAQ and Russell 2000) did manage to hold on to at least half of the day’s gains. There was quite a bit of divergence yesterday, as the S&P 500 and Dow Jones underperformed with gains of 0.2% and 0.1% respectively, while the small cap Russell 2000 and NASDAQ Composite posted solid gains of 1.0% and 0.7% respectively.
Turnover eased on both exchanges during yesterday’s advance, indicating that institutions were not actively buying. If the NASDAQ Composite is able to hold above the low of 8/27 next week, then it will have a shot to produce a buy signal if it can print a follow through day, which is a strong advance of 1.5% or more on heavier volume. A follow through day would then put our timing model back on a buy signal.
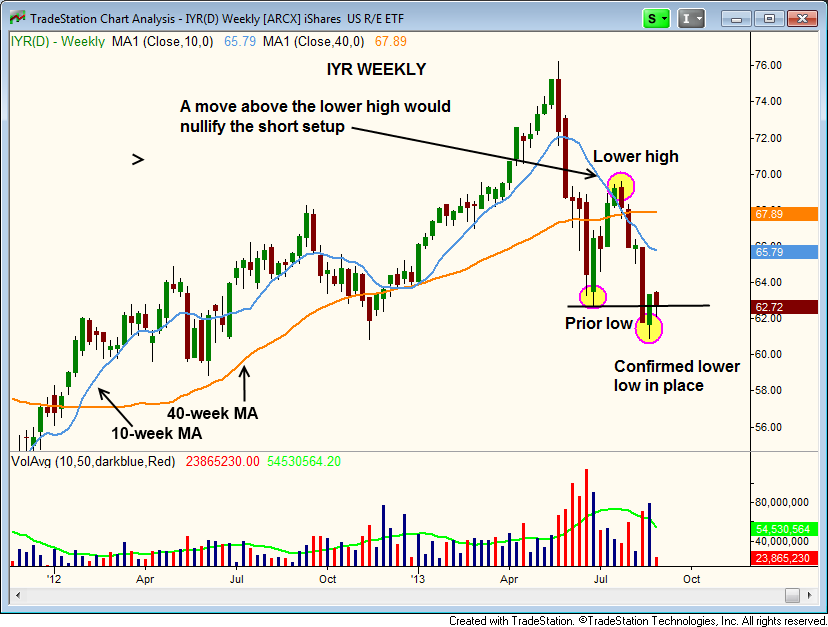
After breaking down below an important swing low two weeks ago, iShares Dow Jones US Real Estate ($IYR) is setting up for a major trend reversal as long as the price action fails to probe above the highs of June (just below $70). $IYR should have a hard enough time getting back above $66, due to resistance from a declining 10-week MA.

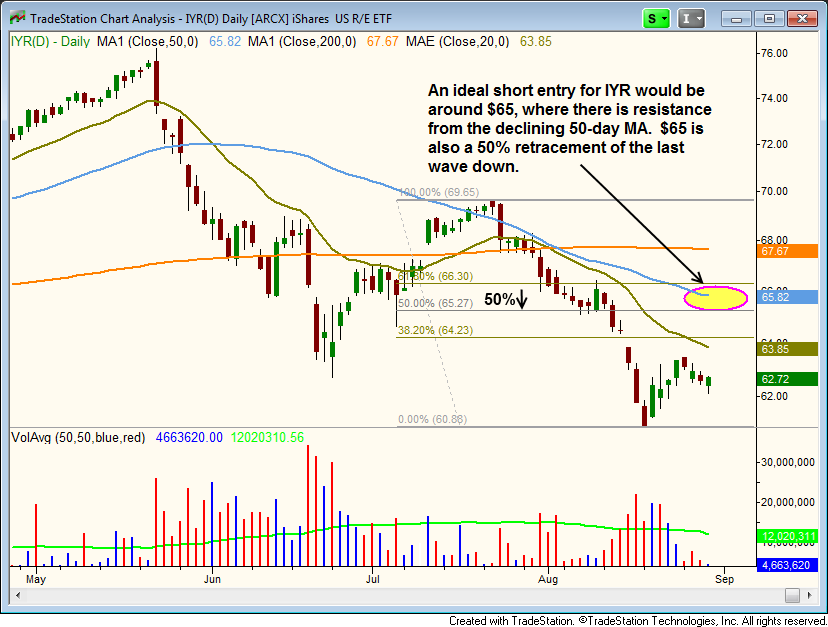
If $IYR is able to rally off the lows, an ideal entry point could emerge on a test of the 50-day MA around $65. This would also coincide with the 50% Fibonacci level at $65.27, measured from the swing high of 7/23 to swing low of 8/19. Also note that the 50-day MA has crossed below the 200-day MA, which is known as a “death cross”, indicating that a bearish, intermediate-term trend reversal is underway.

We continue to lay low due to the recent broad market divergence. The daily charts of the NASDAQ Composite and S&P 500 tell the story, as the NASDAQ is above the 50-day MA, while the S&P 500 is still below. If the NASDAQ continues to hold above the 50-day MA, then the odds of the market going higher after a few more weeks of rest will go up. However, if the NASDAQ breaks the 50-day MA and can’t recover, then we could see a deeper pullback in the overall market.
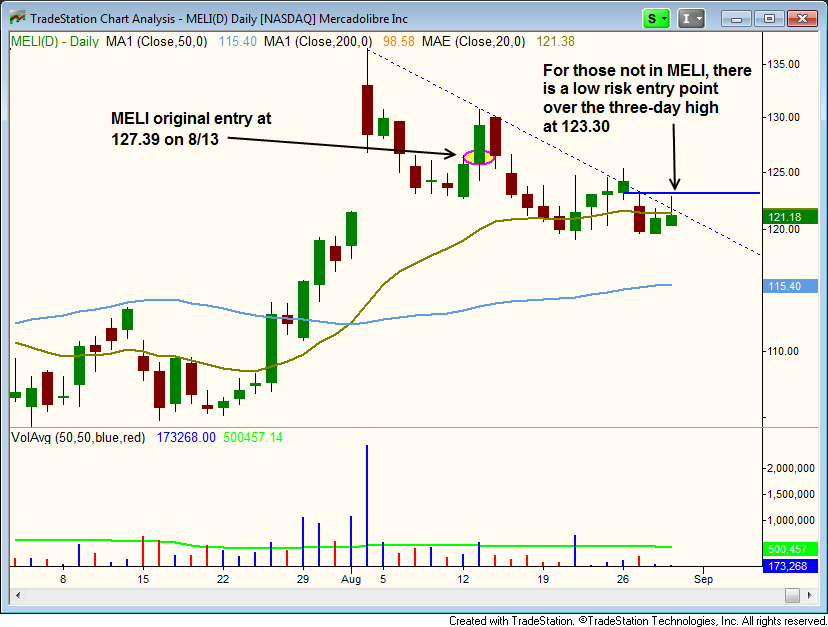
For those who missed our first entry in $MELI on 8/13, the price action over the past few days has produced a low risk entry point over the three-day high.

The price action has vacillated around the 20-day EMA, just below the short-term downtrend line during the past two weeks. However, a move above Thursday’s high on a pick up in volume could spark a short-term rally to the $128 – $130 level. For those entering above the three-day high, please use the stop listed for $MELI in the open positions graphic above.