Portfolio exposure can be anywhere from 0% to 60% long (or more), depending on how open positions have held up.
Past signals:
Neutral signal generated on close of January 24.
- Buy signal generated on close of November 13
- Buy signal generated on close of September 9
- Neutral signal generated on close of August 15
- Buy signal generated on close of July 11
- Neutral signal generated on close of July 5
- Sell signal generated on close of June 24
today’s watchlist (potential trade entries):

Having trouble seeing the open positions graphic above? Click here to view it directly on your web browser instead.
open positions:Below is an overview of all open positions, as well as a report on all positions that were closed only since the previous day’s newsletter. Changes to open positions since the previous report are listed in pink shaded cells below. Be sure to read the Wagner Daily subscriber guide for important, automatic rules on trade entries and exits.

Having trouble seeing the open positions graphic above? Click here to view it directly on your web browser instead.
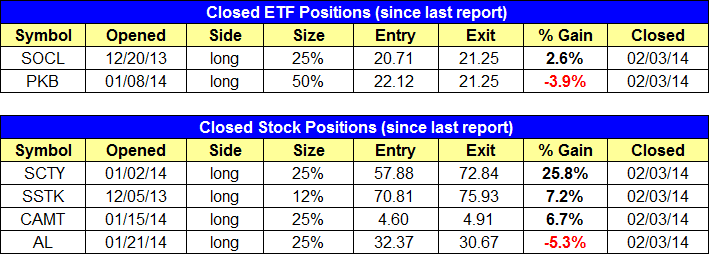
closed positions:
Having trouble seeing the closed positions graphic above? Click here to view it directly on your web browser instead.
ETF position notes:
- Stopped out of $PKB for a loss and sold partial size in $SOCL for a small gain.
stock position notes:
- Stops triggered in $SCTY, $SSTK, $AL, and $CAMT. The only loss of the three was in $AL, but with a 25% position.
ETF, stock, and broad market commentary:Tuesday’s action was the nail in the coffin for the current rally, forcing our market timing model into sell mode for the first time since last June. In sell mode, we want to avoid establishing new longs, as all major averages are operating well below the 50-day MA and most have broken significant swing lows (an uptrend is no longer in place).
Our model shifted into neutral on the close of Jan. 24, and we have been laying low for the most part since then with the exception of a small long trade in $BOSC and the recent buy entry in Natural Gas ETF ($UNG).
With the timing model now sitting at a sell, the short side of the market is a possibility. However, since the market is already deeply oversold, we feel it’s best to wait for a decent bounce to initiate new short positions.
This is because playing the short side requires much more skill in terms of market timing, as the selloffs and counter trend rallies are much more violent on the short side, making for shorter-term holds (It may take a market almost a year to rally 20% and maybe one or two months to give back 75% of that advance).
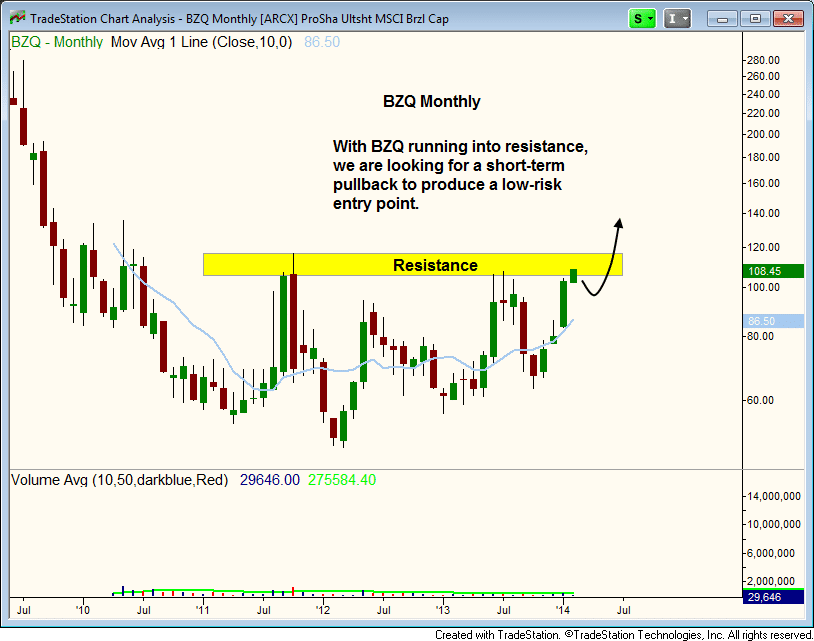
With logical short entries maybe one or two weeks away, it makes sense to list potential short setups all this week. First up this week is the ProShares UltraShort MSCI Brazil Capped ($BZQ), which has reached a significant resistance level just above $100. A slight pullback off these levels within the next few weeks could produce an ideal long entry point in this inverted ETF.
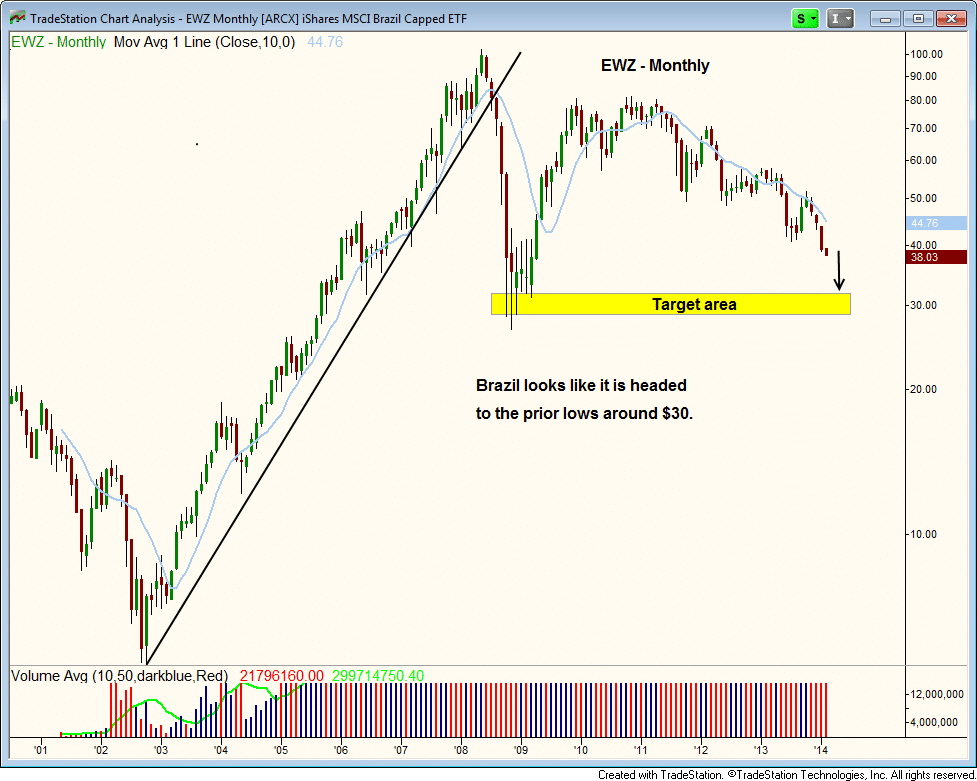
 Looking at a chart of iShares MSCI Brazil Index ($EWZ) below, we see that the price action is in a clear downtrend and appears headed for prior lows of 2008-2009 around $30. $EWZ has another 20% to 30% to selloff before hitting support, which means that $BZQ could double this amount since it is an UltraShort.
 We remain long $UNG from our buy entry off the 10-day MA last week. The pullback has been bullish, forming a hammer reversal off the 10-day MA last Friday, which was followed by a tight ranged inside day on lighter volume. For those on the sideline but looking to enter $UNG, the two-day pause is a low risk area to get on board a new uptrend (see trade details in the watchlist section above).
 On the hourly chart, the action has tightened up nicely, with the 20-period EMA flattening out. Because $UNG sold off sharply last week, it may not take out the prior swing high right away, but should continue to form higher lows above the 10-day MA (on daily chart) as it consolidates.
 On the stock side, we stopped out of several positions, most for a gain. The $AL loss was on reduced share size at 25%, as it was originally sized as a 50% position with a 30.69 stop. $SCTY triggered its sell stop for a solid 25% gain.
We are basically down to a few winning stocks that have shown relative strength. At this point the action is up to the market. If these stocks remain strong, then we will continue to hold. If not, we will probably get stopped out along the way as the market does its thing.
As mentioned above, it is a bit too late to get busy on the short side. But we can spend some time on what type of setups we do look for in a short this week.
As with the long side, we are very detailed in what we look for in a short. We have two basic setups with very different looks in terms of where these stocks are in relation to 52-week highs.
The first setup and the one we favor the most is where we short a former leading stock. These stocks have rallied 300% to 1,000% or more during the length of the last bull market and are over-owned by institutions. They are usually just breaking down off an all-time high, and are 20-30% off the 52-week high once they hit our radar screen. The idea is once these stocks begin to crack, institutions must start unloading shares, making for some violent moves to the downside.
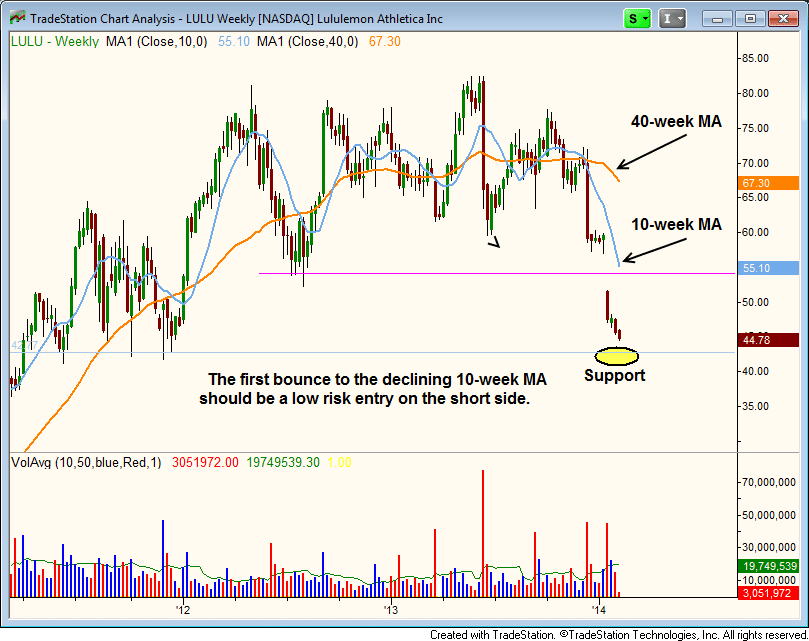
$LULU is a good example of a stock breaking down below key support levels after a monster four-year rally.
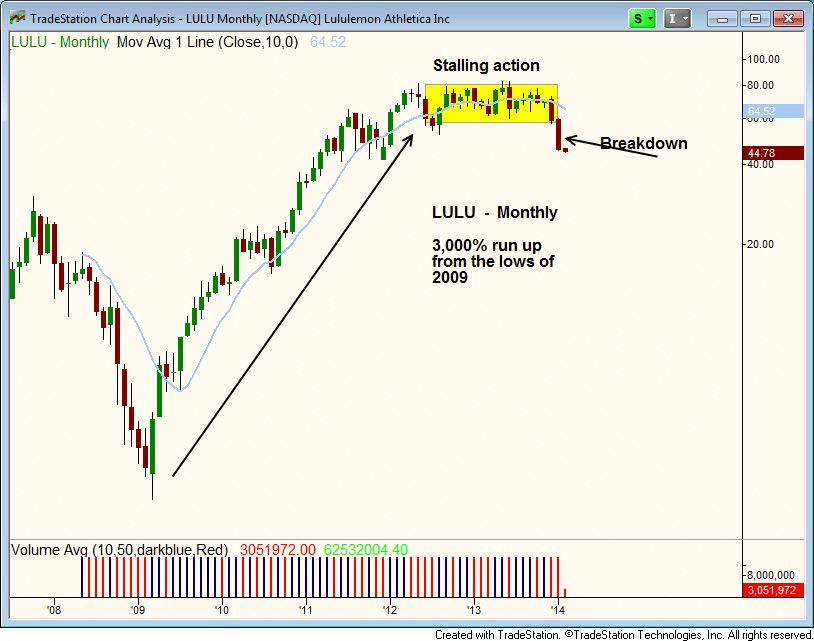 The monthly chart shows the huge advance and subsequent stalling action in 2013. Last week’s breakdown below key support is a bearish sign and should lead to a test of the $40 – $42 area. From there $LULU may form a bearish base at the lows or bounce into the declining 10-week MA on the weekly chart below.
 We will cover the second short type of setup in tomorrow’s report, which is where we short stocks in an ugly downtrend that are near 52-week lows.