Commentary:
Stocks ended mixed in Friday’s action. For the third consecutive session blue chip stocks demonstrated relative strength against the broader market. The Dow Jones Industrial Average rallied 0.4%, while the S&P 500 tacked on 0.2% on Friday. The S&P MidCap 400, the Nasdaq and the small-cap Russell 2000 fell 0.3%, 0.5% and 0.7% respectively. Weakness among tech stocks continues to weigh on the market.
Volume varied dramatically between the NYSE and the Nasdaq. Volume increased by 5.5% on the Big Board, but decreased by 17% on the Nasdaq. The advancing to declining volume ratio also diverged between the two indices. The NYSE saw advancing volume outpace declining volume by a ratio of 1.4 to 1. On the Nasdaq, declining volume held the upper hand by a factor of 1.6 to 1. Even though internals were mixed, market leaders continued to struggle on Friday.
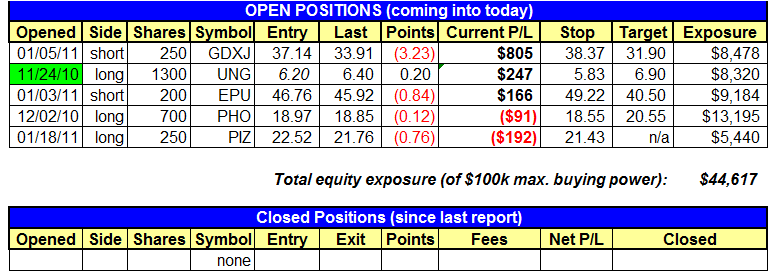
Yesterday we sent an intraday alert that we purchased an additional 300 shares of UNG at market (6.45). We now have 1,300 shares total, with a stop at 5.83 for the full position. Based on Friday’s price action, we are removing PIE from the watchlist. We were stopped out of the remaining 1,000 shares we held in PBW last Thursday. We exited at $10.52 which resulted in a small loss of $130.00. Overall the trade was a scratch since we sold 600 shares of PBW on January 13th for a $192.00 profit. PBW is a good example of why it can be a good practice to sell part of a position into strength even if the target is not hit.
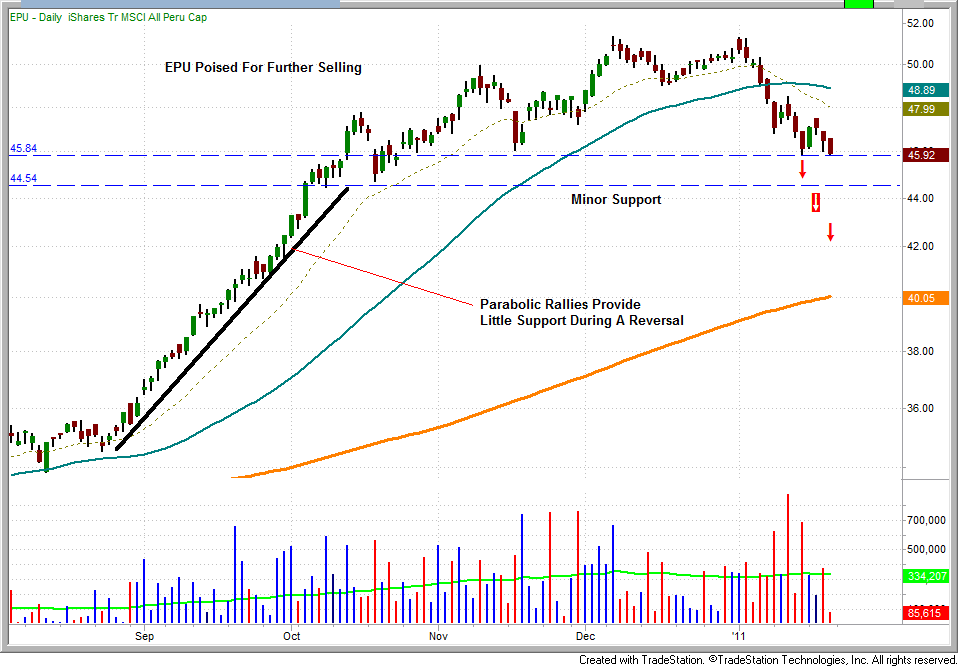
Our position in the iShares MSCI All Peru Capped Index ETF (EPU) has been acting well and is now on the cusp of losing major support. If EPU loses Friday’s low of $45.87, it could plummet quickly. From August 24th until October 15th, EPU made a parabolic move to new highs. However, when this type of move occurs, by definition, there are no levels of support formed. Consequently, the retracements can be as powerful as the rally. If EPU does fall below this key mark, we may add to the position. Caution is still warranted as EPU could easily reverse off this level. There is no place for anticipatory euphoria in the world of trading. If EPU finds support here, the declining 20-day EMA and 50-day MA should provide formidable resistance.
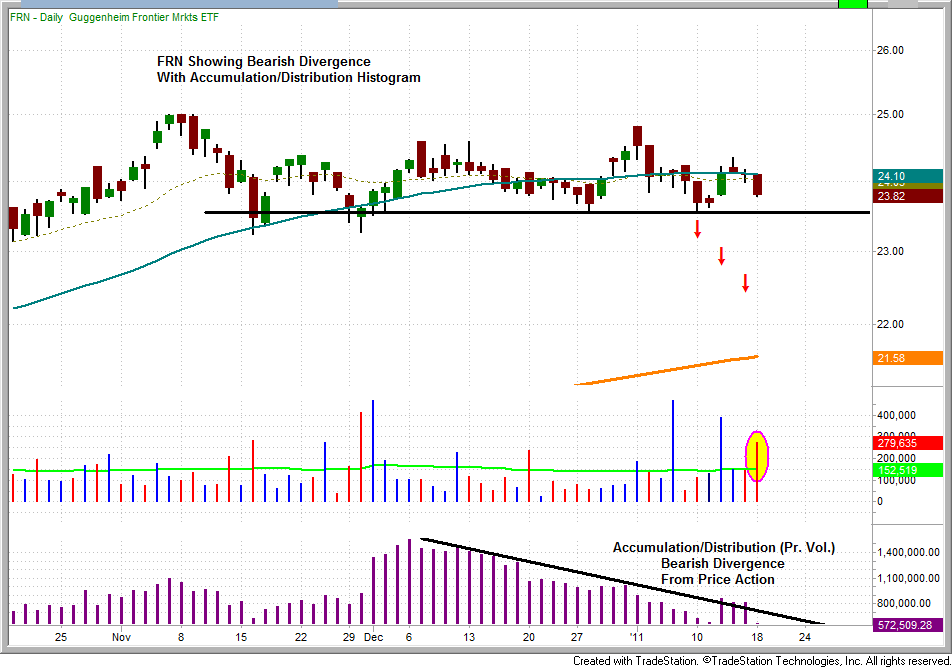
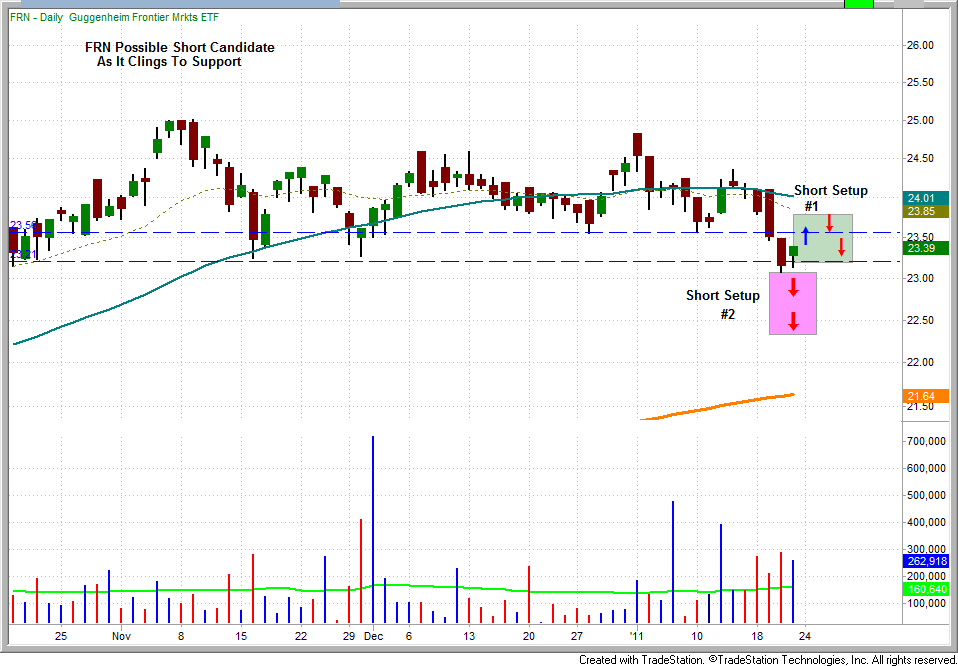
In the January 19th newsletter we discussed The Guggenheim Frontier Markets ETF (FRN) as a potential short setup. We stated, “(it) is exhibiting signs of relative weakness and may soon present a shorting opportunity. Yesterday (January 19th), FRN sold off on a sizeable increase in volume. Further, since mid November, FRN has been consolidating while the Accumulation/Distribution line has been in a significant downtrend. This bearish divergence suggests institutional selling. A break below $23.50 could provide a short entry trigger for this ETF”. Since that time FRN lost support at $23.50 but did bounce yesterday. This ETF now presents two possible short entries. The first would be a rally back into resistance (just above $23.50) on light volume. The second potential short trigger would be a break below Friday’s low. We like the setup and will be watching it closely for a possible entry.
January 19 chart of FRN:
The damage done to market leaders over the past three sessions will likely take several weeks to repair in order to create a new base for another potential rally. When market leaders lose relative strength caution is warranted. It appears as if money has been flowing out of the Nasdaq, the small-cap Russell 2000 and the S&P MidCap 400, and into blue chip issues. Technology stocks are almost always a leading indicator to market direction. It is generally not a good sign for bulls when money begins moving in this manner after a protracted advance.
Today’s Watchlist:
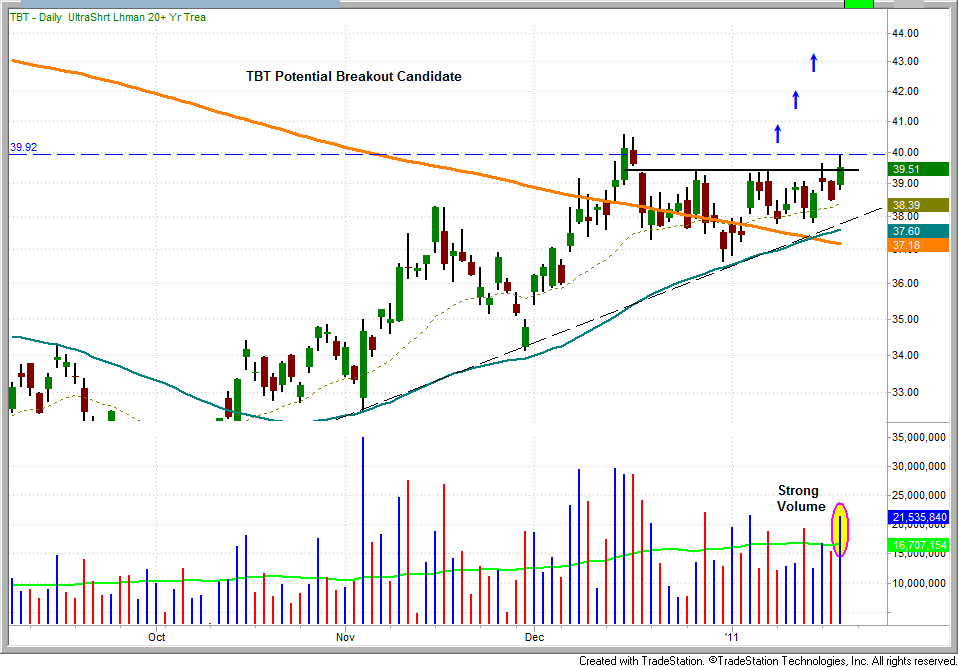
TBT
Long
Shares = 300
Trigger = 39.97
Stop = 38.22
Target = 43.70
Dividend Date = n/a
Notes = see commentary from the Jan. 21 report
Daily Performance Report:
Below is an overview of all open positions, as well as a performance report on all positions that were closed only since the previous day’s newsletter. Net P/L figures are based on the $50,000 Wagner Daily model account size. Changes to open positions since the previous report are listed in red text below. Please review the Wagner Daily Subscriber Guide for important, automatic rules on trigger and stop prices
Per intraday alert, we added 300 shares to our UNG long position on the breakout above 6.40.
- Reminder to subscribers – Intraday Trade Alerts to your e-mail and/or mobile phone are normally only sent to indicate a CHANGE to the pre-market plan that is detailed in each morning’s Wagner Daily. We sometimes send a courtesy alert just to confirm action that was already detailed in the pre-market newsletter, but this is not always the case. If no alert is received to the contrary, one should always assume we’re honoring all stops and trigger prices listed in each morning’s Wagner Daily. But whenever CHANGES to the pre-market stops or trigger prices are necessary, alerts are sent on an AS-NEEDED basis. Just a reminder of the purpose of Intraday Trade Alerts.
- For those of you whose ISPs occasionally deliver your e-mail with a delay, make sure you’re signed up to receive our free text message alerts sent to your mobile phone. This provides a great way to have redundancy on all Intraday Trade Alerts. Send your request to [email protected] if not already set up for this value-added feature we provide to subscribers.
Having trouble seeing the position summary graphic above?
Click here to view it directly on your Internet browser instead.
Notes:
Edited by Deron Wagner,
MTG Founder and
Head Trader