Current signal generated on close of August 15.
Portfolio long exposure can be anywhere from 30%-50% if you just joined the letter, or up to 100% (if your stocks are holding up).
Past signals:
- Buy signal generated on close of July 11
- Neutral signal generated on close of July 5
- Sell signal generated on close of June 24
today’s watchlist (potential trade entries):

Having trouble seeing the open positions graphic above? Click here to view it directly on your web browser instead.
open positions:
Below is an overview of all open positions, as well as a report on all positions that were closed only since the previous day’s newsletter. Changes to open positions since the previous report are listed in pink shaded cells below. Be sure to read the Wagner Daily subscriber guide for important, automatic rules on trade entries and exits. Click here to learn the best way to calculate your share size.

Having trouble seeing the open positions graphic above? Click here to view it directly on your web browser instead.
closed positions:
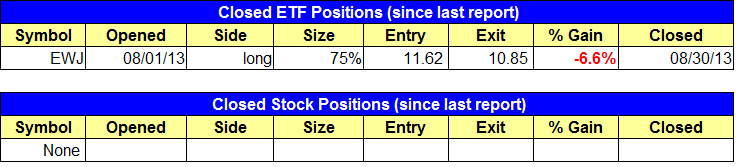
Having trouble seeing the closed positions graphic above? Click here to view it directly on your web browser instead.
ETF position notes:
- Stopped out of $EWJ into the close on Friday.
stock position notes:
- No trades were made.
ETF, stock, and broad market commentary:
Stocks sold off across the board last Friday. The losses were mild on the S&P 500 and Dow, but heavy in small and mid-cap stocks, with both the S&P 400 and Russell 2000 closing down at least 1.4%. The NASDAQ Composite (and NASDAQ 100) are the only major averages still holding above the 50-day MA on the daily chart.
United States Oil Fund ($USO) broke out from a five-week consolidation last week, but failed to close above the highs of the range on the weekly chart (but not by much). A false breakout is fairly common with bullish chart patterns and we usually like to see a stock or ETF recover from a false breakout within a few sessions. This means that $USO should probably hold support at the rising 20-day EMA and close back above $38.60 by the end of the coming week. A move above last Friday’s high (+ 5 cents) is a low risk point for subscribers who are not already in.

PowerShares Gld Drg Haltr USX China($PGJ) is one of the few (non-metal related) ETFs to outperform the S&P 500 over the past few weeks. But after a strong 10-week advance from the touch of the 40-week MA in late June, $PGJ may be due for a 4-5 week correction. We believe that $PGJ will eventually rally to the prior highs of 2011, but is in need of a short rest before doing so. Look for the 10-week MA to catch up while $PGJ consolidates in a tight range.

The daily chart below details the relative strength in $PGJ over $SPY. We also see that $SPY has failed a recent breakout to new highs in August, while $PGJ held the breakout and has pushed significantly higher.

$EWJ triggered a sell stop in the final minutes of trading last Friday, and we are out the position. Please exit on Tuesday’s open if your sell stop did not trigger.
$MELI undercut the prior swing low last Friday, but did not close in the upper third of the day’s range, which suggests that we could see more down side this week. If we are stopped out, then we will look for a re-entry point around the 50-day MA.
We have one new buy setup today in $HIMX, which is finding support at the 10-week MA on the weekly chart below:

Our buy entry is above the two-week high, which should also put the action over the downtrend line of the consolidation. The big spike in volume post earnings in late July indicates strong demand. We look for the price action to hold above the 50-day MA as the price action fills out the right side of the base over the next few weeks. Note the reduced position sizing, as $HIMX has quite a bit of work to do so we are going with small size.
$HIMX has great potential on the monthly chart, as a breakout from the current base could easily lead to a move to new all-time highs (prior all-time high is from 2006 at 9.45).