Current signal generated on close of August 15.
Portfolio long exposure can be anywhere from 30% to 100% (if your stocks are holding up).
Past signals:
- Buy signal generated on close of July 11
- Neutral signal generated on close of July 5
- Sell signal generated on close of June 24
today’s watchlist (potential trade entries):

Having trouble seeing the open positions graphic above? Click here to view it directly on your web browser instead.
open positions:
Below is an overview of all open positions, as well as a report on all positions that were closed only since the previous day’s newsletter. Changes to open positions since the previous report are listed in pink shaded cells below. Be sure to read the Wagner Daily subscriber guide for important, automatic rules on trade entries and exits. Click here to learn the best way to calculate your share size.

Having trouble seeing the open positions graphic above? Click here to view it directly on your web browser instead.
closed positions:
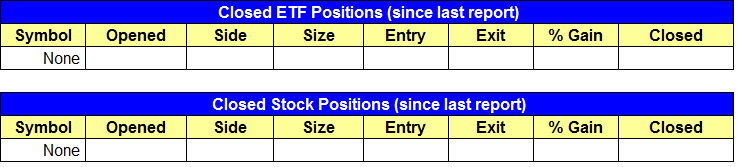
Having trouble seeing the closed positions graphic above? Click here to view it directly on your web browser instead.
ETF position notes:
- No trades were made.
stock position notes:
- $SYNA buy entry triggered, as well as the first buy entry in $BERY.
ETF, stock, and broad market commentary:
Stocks wrapped up the week on a positive note last Friday, as the main stock market indexes gained an average of 0.4% after oscillating in a narrow range throughout the day. Turnover rose in both exchanges, though the sharply higher volume of the NASDAQ was due to the exchange being closed for half of the previous day. Still, last Friday’s advance but the NASDAQ back within 1% of its previous highs from earlier this month.
One week ago, we pointed out the bullish trend reversal pattern of iShares Silver Trust ($SLV) and said we were stalking the ETF for potential buy entry. Specifically, we said, “$SLV has convincingly broken out above resistance of a downtrend line (dotted black line) that had been in place throughout all of 2013. That breakout above the downtrend line also coincided with a sharp move back above its 10-week moving average (roughly equivalent to the 50-day moving average on the daily chart). Furthermore, last week’s rally in $SLV was confirmed by a sharp increase in volume. This, of course, indicates institutional money flow into the ETF.”
To refresh your mind, here’s the weekly chart pattern we showed at the time of our original analysis:

As for our buy entry strategy, we said “Ideally, we would like to see $SLV retrace back down to near the prior downtrend line (which has now become the new support level). However, even if $SLV does not pull back that much, we will be looking for either the formation of a bull flag type pattern on its daily chart, OR a pullback that forms a bullish reversal candle (at which time we would look to buy above that day’s high in the following session).”
Of the above scenarios, $SLV went on to form a bull flag pattern that led to a sharp rally and resumption of the bullish momentum on August 23. On the annotated chart of $SLV below, please see that the ETF surged 4% higher last Friday:

When analyzing a bull flag chart pattern, the width of the flag (the price consolidation) part of the pattern should be approximately equal to number of days it took for the flagpole (vertical part of the pattern) to form. In this case, the bull flag pattern was nicely formed because the width of the pattern was five days (before last Friday’s rally), while the height of the pattern was six days.
As mentioned in our original commentary, silver ($SLV) continues to outperform and show relative strength to gold ($GLD) as well. Below, the percentage change chart compares the gains of $SLV vs. $GLD since both ETFs bottomed out at the end of June:

As you know, we are already long silver from our August 21 buy entry into the leveraged ProShares Ultra Silver ($AGQ). Since the ETF is designed to move at double the percentage change of the spot silver commodity, $AGQ zoomed 8% higher last Friday and should continue significantly higher in the near-term.
As we enter the new week, the only trade setup on our watchlist is $USO. If the ETF triggers our buy entry by rallying above its prior “swing high,” it will be in addition to our existing position that we originally bought when the ETF first broke out in early July.
On the stock side, buy setups in $SYNA and $BERY triggered, although we still have an open buy order for the second entry in $BERY. We also have a new buy setup in $DDD.
We are looking for a downtrend line breakout on the daily chart in $SYNA after a tight consolidation at the 50-day MA. The 50-day MA minus some wiggle room is the stop.

The monthly chart is quite interesting, as $SYNA is attempting to breakout from a 5 year long consolidation. $SYNA must first break the daily downtrend line, then push through resistance at $43 and $46 to establish a new all-time high. If it can get there, then it will have no significant resistance in its way.

We raised the stop in $WDAY once again to lock in profits ahead of this Tuesday’s earnings report (after the close). We also have a new target price in place, which will allow us to capture gains into strength if there is a pop ahead of the report. Please be sure to exit the position by Tuesday’s close to avoid holding through earnings.
