Current signal generated on close of August 15.
Portfolio long exposure can be anywhere from 30% to 100% (if your stocks are holding up).
Past signals:
- Buy signal generated on close of July 11
- Neutral signal generated on close of July 5
- Sell signal generated on close of June 24
today’s watchlist (potential trade entries):

Having trouble seeing the open positions graphic above? Click here to view it directly on your web browser instead.
open positions:
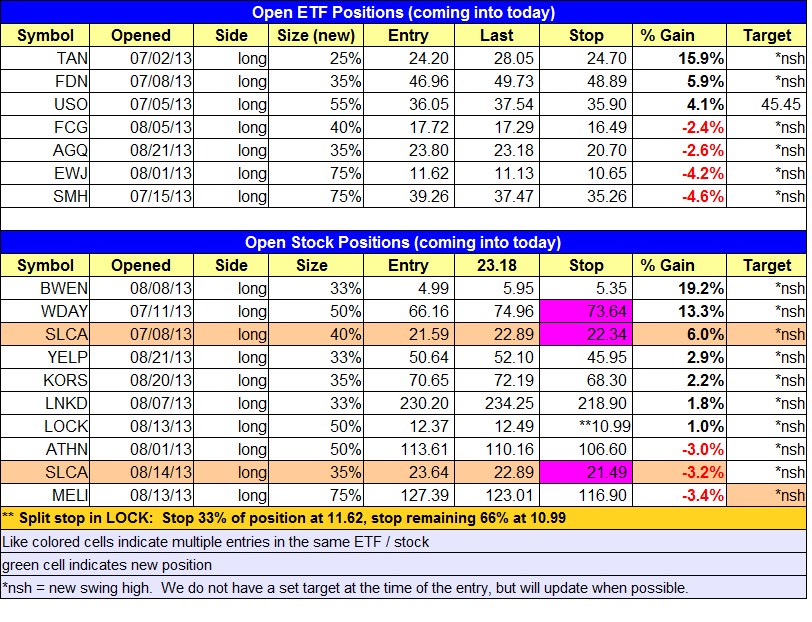
Below is an overview of all open positions, as well as a report on all positions that were closed only since the previous day’s newsletter. Changes to open positions since the previous report are listed in pink shaded cells below. Be sure to read the Wagner Daily subscriber guide for important, automatic rules on trade entries and exits. Click here to learn the best way to calculate your share size.

Having trouble seeing the open positions graphic above? Click here to view it directly on your web browser instead.
closed positions:

Having trouble seeing the closed positions graphic above? Click here to view it directly on your web browser instead.
ETF position notes:
- $YINN buy setup cancelled due to 1.3% gap up above our trigger.
stock position notes:
- Note the new stops listed above. We plan to sell half of $SLCA if it does not move out right away and dips back below the 20-period EMA on the hourly chart.
ETF, stock, and broad market commentary:
The NASDAQ Composite led the market higher yesterday, gaining 1.1% and closing back above the 10-day MA and 20-day EMA. The S&P 500 also printed a solid gain of 0.9% but could not reclaim the 50-day MA. Turnover was lighter on both exchanges, but trading was halted on the NASDAQ for a few hours, so it was almost a half session of trading.
The Dow Jones is the only index to make a clear break of the 50-day MA. As we mentioned earlier in the week, the divergence suggests that the market may need a few weeks of rest, chopping back and forth in a tight range before heading higher. With most leadership stocks acting well, we believe that the NASDAQ has a pretty good shot of eventually setting new swing highs. However, market conditions can change quickly, and that is why we do not believe in making bold predictions. By focusing on what is in front of us (price and volume action), we can trade what we see and not what we think!
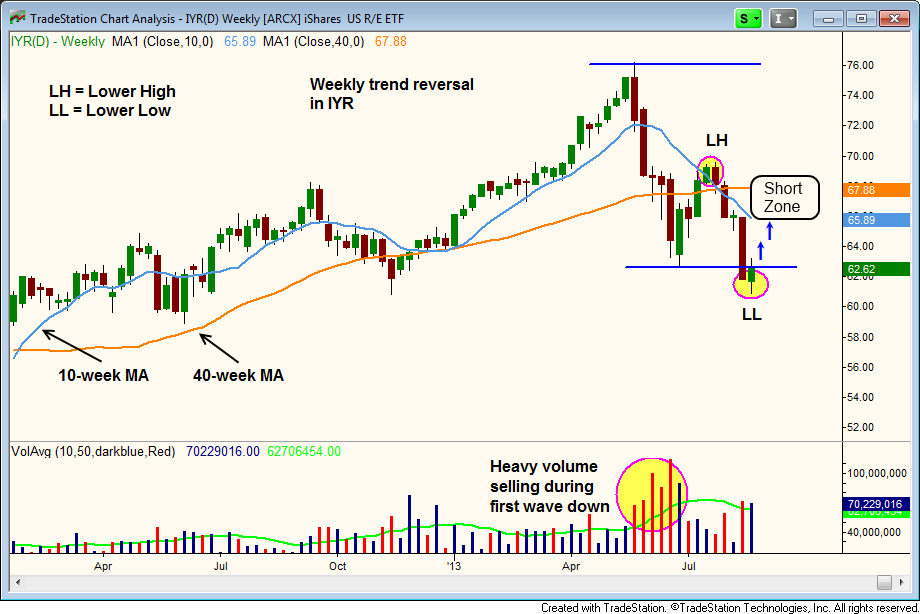
The iShares U.S. Real Estate ETF ($IYR) looks to be in trouble after an ugly breakdown below the 200-day MA (same as 40-week MA) in August. The weekly chart below is pretty ugly, as the mutli-year uptrend appears to be reversing to downside.

From 5/19 to 6/23 on the weekly chart, $IYR sold off on heavy volume, breaking down below the 10 and 40-week MAs. After a light volume bounce above the 40-day MA, the price action stalled at the 10-week MA and sold off again, breaking down below the prior swing low. By breaking the last swing low, $IYR has now set a lower high and lower low on the weekly chart, which signals a potential reversal of trend.
Along with the price action breaking down below the moving averages, the 10-week MA crossed below the 40-week MA, which is a bearish trend reversal signal, indicating that an intermediate-term top may be in place.
We typically do not like to short a breakdown below an obvious swing low unless there is some sort of tight consolidation that forms near the prior low. With $IYR there was just a big breakdown on the weekly chart, so conditions are oversold in the short-term and due for a bounce. Currently $IYR is not a low risk short entry, but a bounce to the 10-day MA over the next few weeks to the $65.00 area would be ideal.
On the stock side we have two new buy setups for today in $BERY and $SYNA. In $SYNA we are looking to establish about a 1/3 position above Thursday’s high, which should eventually lead to a downtrend line breakout on the daily chart. We will add to the position if it pushes higher. $SYNA is not an A rated stock, but its fundamentals have improved over the past 3 quarters, so it is a solid B to B+.
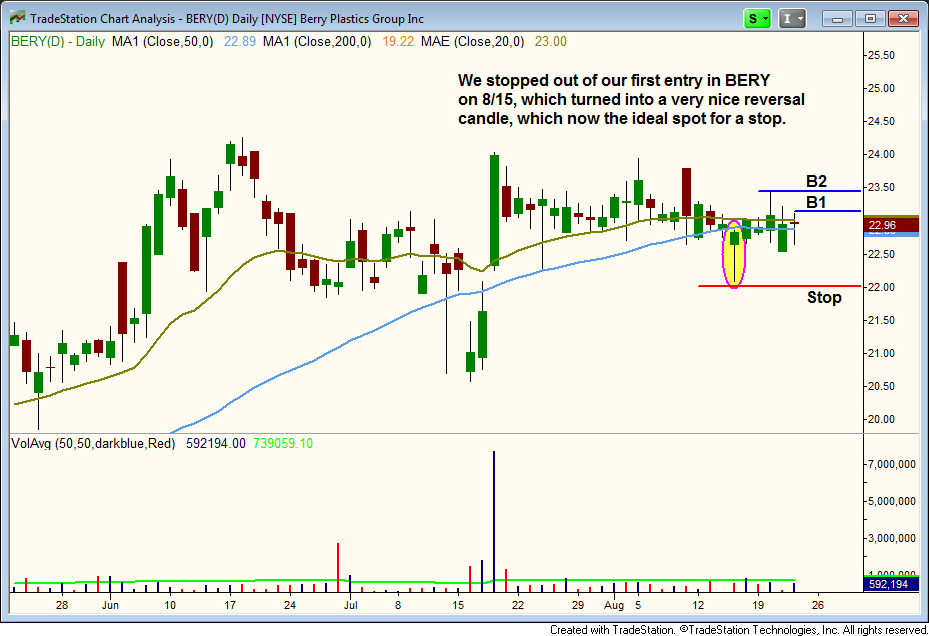
Our chart for today will focus on $BERY:

Our first buy in $BERY fell victim to a nice washout candle on 8/15, which scared off all the weak longs (including us). Although we stopped out, the price action continued to stay tight around the 50-day MA, preventing us from removing the stock from our top internal watchlist.
We have two buy points in $BERY. The first entry (buy #1) is over yesterday’s high and the second entry (buy #2) is over the three-day high. The washout bar on 8/15 provides us with an ideal stop. A move below the 8/15 would probably send $BERY much lower in the short-term.
Other setups that are looking good are: OSTK (above 31.00), GIMO (above 36.60 and 37.20), and QLYS (above 19.18).