Sell Mode
– Timing model generated sell signal on close of February 25 (click here for more details)
today’s watchlist (potential trade entries):

Having trouble seeing the open positions graphic above? Click here to view it directly on your web browser instead.
Below is an overview of all open positions, as well as a report on all positions that were closed only since the previous day’s newsletter. Net P/L figures are based on two separate $50,000 model portfolios (one for ETFs and one for stocks). Changes to open positions since the previous report are listed in pink shaded cells below. Be sure to read the Wagner Daily subscriber guide for important, automatic rules on trade entries and exits.

Having trouble seeing the open positions graphic above? Click here to view it directly on your web browser instead.
closed positions:
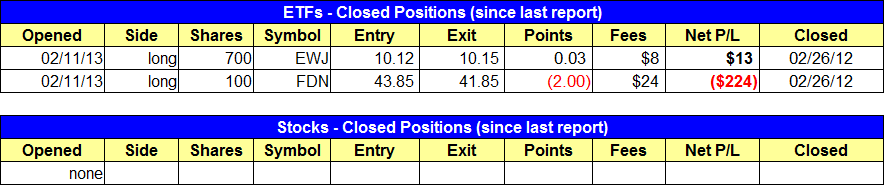
Having trouble seeing the closed positions graphic above? Click here to view it directly on your web browser instead.
ETF position notes:
- $FDN and $EWT positions were closed. $QID long entry triggered.
stock position notes:
- $CMG, $YUM, and $DKS short entries triggered.
ETF, stock, and broad market commentary:
After a slight undercut of the prior day’s low, the major averages reversed higher in the afternoon and closed well off the lows of the session. The percent gains were not terribly impressive, with the S&P 500 and Nasdaq Composite up 0.6% and 0.4% respectively. Turnover was a let down as well, as volume decreased on both exchanges. The bearish volume pattern remains intact, as we continue to see heavy volume down days followed by lighter volume up days.
We established a short position in $QQQ yesterday by going long the ProShares UltraShort QQQ ($QID). $QQQ could push higher over the next few days, but there is plenty of overhead resistance around 67.00.

There is resistance from the 50% to 61.8% Fibo retracement levels around 67.00 (measured from recent swing high to Tuesday’s low), as well as the declining 20-day EMA. The close and low of first ugly reversal candle on 2/20 is at 67.00. Also, all through January, $QQQ struggled to clear 67.00.
GOLD has taken a beating the past two weeks after stalling out at resistance of the broken uptrend line (on the monthly chart below) and failing to hold support of the 200-day MA on a daily chart.

The 150.00 area is a key support level because if it does not hold, then $GLD will have confirmed a break of the long-term uptrend line. The weekly line chart below is a great view of the action since 2009.

A clear break of 150.00 will put $GLD in distribution phase, where could see a series of lower highs and lower lows emerge on the weekly chart over several months.
We are monitoring $GLD on the short side but today’s chart is not actionable, as we do not have a reliable entry in place.
On the stock side all three short entries triggered. The dollar risk on all three positions total is not much more than our risk in $QID. Our plan with these shorts is to look for a quick 10% to 20% breakdown and take profits into weakness. Unlike the long side where we look to hold stocks through a pullback and for several weeks, we prefer to take the money and run on the short side.
$UPL is setting up on the short side. This is a classic swing trade setup, with the price action breaking down from a base within a downtrend and bouncing into resistance. Monday’ stalling action is the entry signal. A move below Tuesday’s low should lead to a move to new swing lows over the next two weeks, with a clear stop above Monday’s high. Although we like $UPL, the setup is not official and will not be added to the watchlist, as we are satisfied with the amount of short exposure we currently have on. Again, just to be clear, $UPL is not an official trade and will not be tracked in the portfolio.

If you are a new subscriber, please e-mail [email protected] with any questions regarding our trading strategy, money management, or how to make the most out of this report.
relative strength combo watchlist:
Our Relative Strength Combo Watchlist makes it easy for subscribers to import data into their own scanning software, such as Tradestation, Interactive Brokers, and TC2000. This list is comprised of the strongest stocks (technically and fundamentally) in the market over the past six to 12 months. The scan is updated every Sunday, and this week’s RS Combo Watchlist can be downloaded by logging in to the Members Area of our web site.