market timing model:
Sell – Signal generated on the close of October 12 (click here for more details)
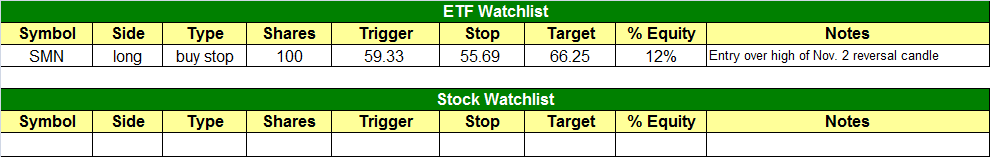
today’s watchlist (potential trade entries):
Having trouble seeing the open positions graphic above? Click here to view it directly on your web browser instead.
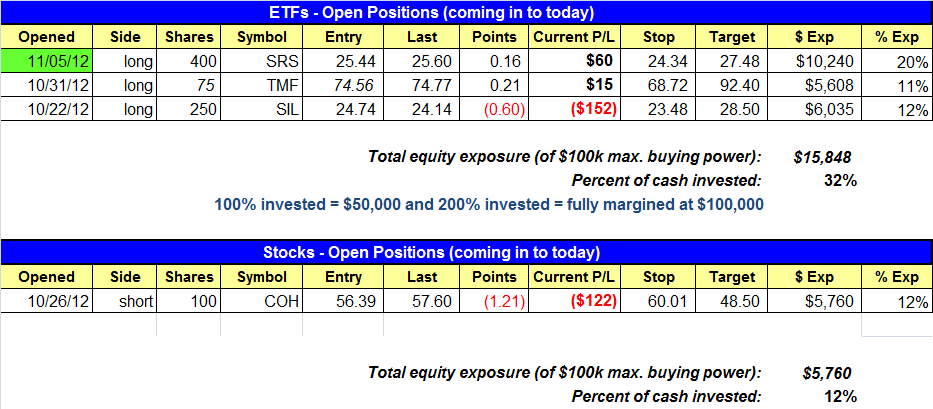
open positions:
Below is an overview of all open positions, as well as a report on all positions that were closed only since the previous day’s newsletter. Net P/L figures are based on two separate $50,000 model portfolios (one for ETFs and one for stocks). Changes to open positions since the previous report are listed in pink shaded cells below. Be sure to read the Wagner Daily subscriber guide for important, automatic rules on trade entries and exits.
Having trouble seeing the open positions graphic above? Click here to view it directly on your web browser instead.
closed positions:

Having trouble seeing the closed positions graphic above? Click here to view it directly on your web browser instead.
ETF position notes:
- SRS buy entry triggered.
stock position notes:
- KO short setup is cancelled.
ETF and broad market commentary:
After opening near the flatline, stocks chopped around in an indecisive range throughout the entire day before finishing near their intraday highs and in positive territory. The Nasdaq Composite ($COMPX) rebounded the most by gaining 0.7%, though it was also the index that fell the most in the previous day’s session. Both the S&P 500 Index ($SPX) and Dow Jones Industrial Average ($DJIA) edged only 0.2% higher. The small-cap Russell 2000 ($RUT) and S&P Midcap 400 Index ($MID) bounced 0.7% and 0.6% respectively. While yesterday’s broad-based gains may have been encouraging for the bulls, keep in mind that the major indices technically only recovered a small portion of their previous day’s declines.
Pointing to institutional traders staying on the sidelines, substantially lighter volume accompanied yesterday’s half-hearted rally attempt. In both the NYSE and Nasdaq, turnover receded 18%. This means that banks, mutual funds, hedge funds, and other institutions were not active participants in yesterday’s modest advance. Rather, the “smart money” merely took a break from the selling pressure, thereby enabling stocks to move higher With only little bit of buying pressure among the retail masses. Until we start seeing new leadership stocks emerge, as well as higher volume, to confirm the “up days” in the broad market, odds favor remaining on the short side of the market (cash is always a valid option as well).
The ProShares UltraShort Basic Materials ETF ($SMN), an inversely correlated “short ETF,” is now on our radar screen for potential buy entry, as the ETF is poised to break out above resistance of a six-month downtrend line. The technical setup is shown on the daily chart of SMN below:

Since mid-September of this year, SMN has formed two “higher lows,” which hint at an intermediate-term bullish trend reversal. Yesterday, SMN spent the duration of the session consolidating near the previous day’s high, which also was in the area of both its 20-day exponential moving average (beige line) and 50-day moving average (teal line). Now, if SMN rallies above yesterday’s high, it will also represent a breakout above its downtrend line from the June 2012 high, which should spark momentum to send SMN sharply higher in the near-term. Our protective stop price is just below support of the “swing low” from November 2 of this year, while the target price is the area of its early September 2012 high. This provides us with a positive reward to risk ratio on this swing trade setup. Please note our exact trigger, stop, and target prices in the ETF Watchlist section of the newsletter above.
The Direxion 20-year Treasury Bull 3x ($TMF), which we are currently long, gapped up nicely yesterday to close right at its 50-day moving average. Furthermore, it finished just shy of its prior high from late October (the day of our buy entry). From here, the trade will be in good shape if it rallies above yesterday’s high. New subscribers, or those of you who are missed our initial buy entry, may consider buying TMF on a rally above yesterday’s high, as that would constitute a valid secondary buy entry point:

Our other open ETF position, Global X Silver Miners ETF ($SIL), closed slightly lower yesterday, but is still holding near its highs and a bullish pennant formation. With the 50-day moving average rising up to meet support of its current price, we still expect SIL to soon break out of its range and rally to new highs:

Our remaining open ETF position is ProShares UltraShort Real Estate ($SRS), a “short ETF”which triggered for buy entry from yesterday’s ETF watchlist. On an intraday basis, SRS put in a good rally attempt yesterday, but drifted back down to close just above our entry point. Nevertheless, we still like the trade setup and anticipate higher prices in the near-term, barring a sharp and sudden reversal higher in the broad market.
stock commentary:
With the Nasdaq unable to bounce during the past two weeks, our short scans have not produced much in the way of actionable setups. Rather than force the issue, we’ll conitnue to lay low until low-risk setups emerge. For those who are itching to go long, please remember that buying stocks in a weak market is a bad idea and one that has never made us much money (its too easy to dig yourself in a hole).
This is just a quick review of how we methodically re-enter the market:
- Broad market price action must stabilize for a few days by not making lower lows
- More than a few market indicators are hovering at extremely oversold levels (there is plenty of bearish sentiment on Wall Street).
- Construct a relative strength watchlist waiting for conditions to settle down.
- After at least three days of no new lows we look for a significant accumulation day in a major average as confirmation that the market is attempting to bottom out. This accumulation day is usually a 1.5-2% gain on higher volume than the prior day’s session.
- Once the key accumulation day is in place we can begin to add long exposure provided that there are valid buy setups to be found. If there are no buy setups we patiently wait for them to develop. Our goal here is to test the long side with 2-4 positions.
- The best case scenario for our 2-4 long positions is to see them breakout to new highs on strong volume. Once this happens we then begin to increase our market exposure up to 100% and potentially go on margin.
If you are a new subscriber, please e-mail [email protected] with any questions regarding our trading strategy, money management, or how to make the most out of this report.
relative strength combo watchlist:
Our Relative Strength Combo Watchlist makes it easy for subscribers to import data into their own scanning software, such as Tradestation, Interactive Brokers, and TC2000. This list is comprised of the strongest stocks (technically and fundamentally) in the market over the past six to 12 months. The scan is updated every Sunday, and this week’s RS Combo Watchlist can be downloaded by logging in to the Members Area of our web site.