market timing model:
Sell – Signal generated on the close of October 12 (click here for more details)
today’s watchlist (potential trade entries):
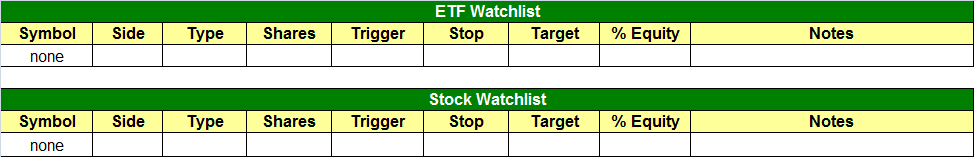
Having trouble seeing the open positions graphic above? Click here to view it directly on your web browser instead.
open positions:
Below is an overview of all open positions, as well as a report on all positions that were closed only since the previous day’s newsletter. Net P/L figures are based on two separate $50,000 model portfolios (one for ETFs and one for stocks). Changes to open positions since the previous report are listed in pink shaded cells below. Be sure to read the Wagner Daily subscriber guide for important, automatic rules on trade entries and exits.
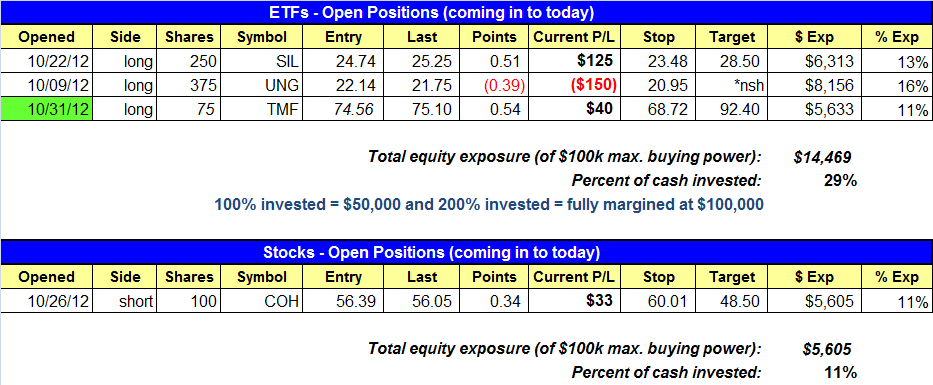
Having trouble seeing the open positions graphic above? Click here to view it directly on your web browser instead.
closed positions:

Having trouble seeing the closed positions graphic above? Click here to view it directly on your web browser instead.
ETF position notes:
- Both TMF buy setups triggered. The entry price above is the average of both entry points.
stock position notes:
- No trades were made.
ETF and broad market commentary:
Coming back from a four-day break, stocks initially gapped slightly higher on the open. But as has been the trend in recent weeks, sellers immediately stepped into strength of the opening gap, causing stocks to quickly erase their gains. The major indices bounced slightly in the afternoon, leaving the broad market with mixed results. The broad-based S&P 500 Index ($SPX) was unchanged, the Dow Jones Industrial Average ($DJIA) slipped 0.1%, and the Nasdaq Composite ($COMPX) fell 0.4%. The one bright spot of the day’s action was small and mid-cap stocks. The Russell 2000 Index ($RUT) rose 0.7% and the S&P Midcap 400 Index ($MID) gained 0.6%.
Total volume in the NYSE was 8% greater than the previous day’s level. Trade in the Nasdaq was only 1% higher. In the NYSE, advancing volume marginally exceeded declining volume. The Nasdaq ADV/DEC volume ratio was negative by a spread of just over 2 to 1. Although turnover remained above 50 day average levels, there was little indication of the return of institutional trading activity.
Although the spot gold and silver commodity ETFs continued trading below their 50-day moving averages after a recent pullback from their highs, it is interesting to note that clear relative strength is being observed in the actual gold and silver mining ETFs. Yesterday, for example, Global X Silver Miners ($SIL) jumped 3.2% higher. Similar action was observed in gold mining ETFs, such as Market Vectors Gold Trust ($GDX), which cruised 3.1% higher. We have been long SIL in our model ETF trading portfolio since October 22, and the ETF is now breaking out above a tight, multi-week base of consolidation. Volume also surged to nearly 4 times its average level yesterday, confirming the breakout attempt above the consolidation:

Emerging markets ETFs that we have been discussing in recent days put in a very mixed performance yesterday. One former market-leading international ETF, Global X Greece ($GREK), plunged a whopping 10.7% yesterday. On the other hand, iShares Philippines Index ($EPHE) showed considerable relative strength by managing to gain 1.3% and closing just shy of its 52-week high. Still, the sudden tumble in market-leading GREK is a good example of why our market timing system remains in “sell” mode, causing us to thereby focus on trading ETFs on the short side of the market.
Although the market indeed feels very weak, it will eventually bounce substantially. When it does, there will be a plethora of technical resistance levels waiting to greet any rally attempt. When that occurs, we will be prepared to take advantage of selling short the weakest ETFs (or buying inversely correlated “short ETFs”). There are already several ETFs we are internally stalking for short entry on a significant market bounce. But the beauty of ETF trading is that we can still seek opportunities on the long side of the market to have a very low correlation to the direction of the main stock market indexes. That includes currency, commodity, or fixed income ETFs.
Yesterday, our long setup in Direxion 30-year Treasury Bond ETf ($TMF) triggered for buy entry, as the ETF rallied to close above its 50-day moving average. As illustrated in the October 29 issue of The Wagner Daily, we are anticipating a resumption of the dominant, long-term uptrend of TMF, now that the intermediate-term correction may be ending. As shown on the daily chart below, we are off to a good start with TMF:

stock commentary:
There are no new setups for today. Our scans did not turn up much in the way of actionable setups on the short side. We are still monitoring CMI for a short entry but we’d like to see a probe above the 50-day MA within the next few days as an ideal entry. Patience is the key right now, as we will probably need a short-term bounce in the market to produce low-risk short entries.
As for the long side of the market, with the timing model sitting on a sell signal and the market yet to establish a higher swing low we remain on the sidelines. Stocks like GNRC and NTE have broken out recently and looking good, but finding 4-5 stocks that are acting well on a list of 500 isn’t something to get excited about. Despite the low odds of success, many investors trade the long side in a bad market hoping to catch a decent winner. Locating a winner is possible but you may have to sit through a bunch of losers to make it happen. And as we have mentioned in the past, controlling your losses on the long side is tough to do when trading against the trend. Overall, it just makes sense to wait for the market to repair itself before going long while waiting for select opportunities to emerge on the short side.
If you are a new subscriber, please e-mail [email protected] with any questions regarding our trading strategy, money management, or how to make the most out of this report.
relative strength combo watchlist:
Our Relative Strength Combo Watchlist makes it easy for subscribers to import data into their own scanning software, such as Tradestation, Interactive Brokers, and TC2000. This list is comprised of the strongest stocks (technically and fundamentally) in the market over the past six to 12 months. The scan is updated every Sunday, and this week’s RS Combo Watchlist can be downloaded by logging in to the Members Area of our web site.