Confirmed Buy– Signal generated on the close of January 22 (click here for more details)
today’s watchlist (potential trade entries):

Having trouble seeing the open positions graphic above? Click here to view it directly on your web browser instead.
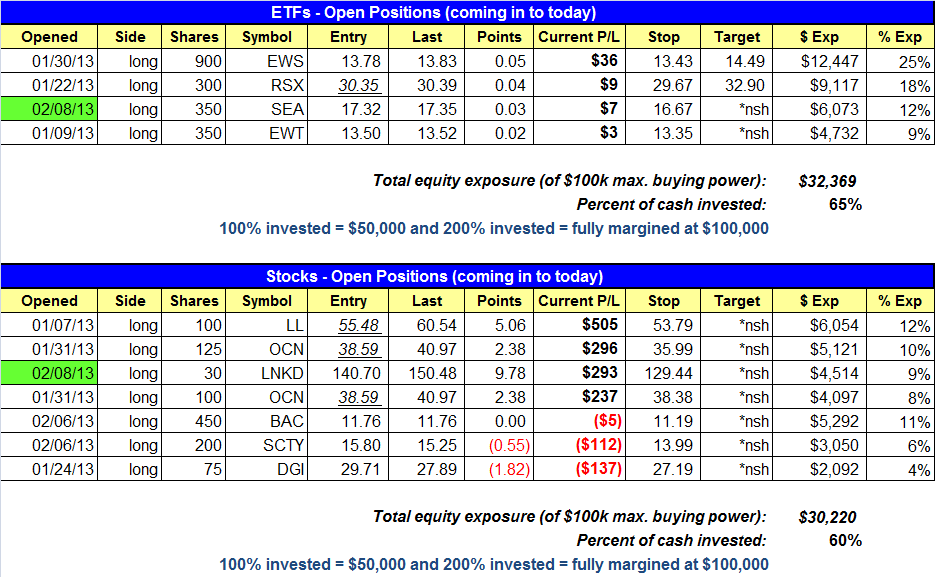
open positions:
Below is an overview of all open positions, as well as a report on all positions that were closed only since the previous day’s newsletter. Net P/L figures are based on two separate $50,000 model portfolios (one for ETFs and one for stocks). Changes to open positions since the previous report are listed in pink shaded cells below. Be sure to read the Wagner Daily subscriber guide for important, automatic rules on trade entries and exits.
Having trouble seeing the open positions graphic above? Click here to view it directly on your web browser instead.
closed positions:
Having trouble seeing the closed positions graphic above? Click here to view it directly on your web browser instead.
ETF position notes:
- $SEA long triggered.
stock position notes:
- $LNKD long triggered on the open.
ETF, stock, and broad market commentary:
After getting off to a rough start last week, stocks recovered to finish on a high note last Friday. The benchmark S&P 500, small-cap Russell 2000, and mid-cap S&P Midcap 400 indices each closed at fresh 52-week highs and rose approximately 0.6%. The laggard Nasdaq Composite showed relative strength for a change, as the tech-heavy index jumped 0.9%. On a closing basis, the Nasdaq also settled at a new 52-week high, but failed to break out above resistance of its intraday highs from September of 2012. The blue-chip Dow Jones Industrial Average ticked just 0.3% higher and is now the only index remaining within the confines of its two-week trading range.
Given the sharp losses that commenced the week last Monday (February 4), newer traders and investors might be forgiven for thinking the broad market was headed for at least a near-term pullback last week. But as we carefully pointed out in our February 5 commentary, the key was that total market volume was lighter that day, indicating a lack of selling amongst banks, mutual funds, hedge funds, and other institutions. As such, it wasn’t shocking that equities quickly recovered and most of the major indices subsequently broke out to new 52-week highs. Although turnover was lighter across the board last Friday, we are always much more concerned with monitoring bouts of distribution (higher volume losses) than accumulation (higher volume gains) when the stock market is already in a steady uptrend.
$SEA buy entry triggered Friday afternoon above the prior day’s high on a pick up in volume. $EWS recovered nicely as well. We plan to add to our position in $EWS on a breakout (see watchlist above for details). As mentioned in Friday’s report, we will not be using the 5-minute rule on the $EWJ buy setup.
On Friday morning, the Nasdaq Composite stalled at the prior high of last September and traded in a tight range the rest of day. It will be interesting to see how the Nasdaq reacts to the 3196 level this week. $AAPL may be the key to a successful Nasdaq breakout, and could provide a much needed spark with a sharp reversal back above the 50-day MA.

The S&P 500 is still top dog in this rally, with the financials, homebuilders/construction, and energy stocks leading the market higher.
In last week’s commentary, we mentioned iShares MSCI Emerging Markets Index Fund ($EEM) as a potential pullback buy if it can hold above its 50-day moving average. The weekly chart below shows the bullish reversal candle in $EEM last week, with the price action closing at the 10-week moving average (which is basically the same as the 50-day MA for us).

Our buy entry is over the high of last week’s reversal candle. If triggered, the price action should not return below last week’s low.
If $EEM can clear last week’s high, the price action will be back above the 20-EMA, 50-SMA, and the downtrend line. We are taking a half position with our fist entry and will look to add to the position once $EEM sets a higher swing low with a reliable entry point.

On the stock side, we do not have any new setups for today. $LNKD triggered a buy entry on the open Friday. We were fortunate to have the price action move in our direction all day. We now look for $LNKD to hold Friday’s low and eventually push MUCH higher.
There will probably be plenty of short selling going on in $LNKD this week (though I can’t imagine what universe this is a short setup in). Many retail and, surprisingly enough, professional traders attempt to short new highs. While shorting is much more difficult than going long, no one who shorts successfully and consistently does so by shorting a breakout to new highs. When you argue with the market and fight the trend you almost always lose, and lose BIG! Those who short new highs need to examine price action in leadership stocks that fall apart. These stocks crumble when the overall market is unhealthy, and the stock breaks down below the 50-day MA. They typically do not fall apart in the middle of a bull market. The combination of a stock making new highs and a monster P/E ratio is just too enticing for eager shorts to pass up. Please remember this if nothing else. Trade what you see…not what you think.
$LCC is one of a few stocks we are monitoring this week for an entry point:

As usual, we’d like to see the price actinon tighten up and form a higher swing low this week above the 20-day EMA. Our analysis is the same week in and week out. If a stock has not formed a higher swing low, then we do not enter, unless it is a pullback entry off the 50-day MA.
If you are a new subscriber, please e-mail [email protected] with any questions regarding our trading strategy, money management, or how to make the most out of this report.
relative strength combo watchlist:
Our Relative Strength Combo Watchlist makes it easy for subscribers to import data into their own scanning software, such as Tradestation, Interactive Brokers, and TC2000. This list is comprised of the strongest stocks (technically and fundamentally) in the market over the past six to 12 months. The scan is updated every Sunday, and this week’s RS Combo Watchlist can be downloaded by logging in to the Members Area of our web site.