Current signal generated on close of July 5
Past signals:
- Sell signal generated on close of June 24
- Neutral signal on the close of June 20
today’s watchlist (potential trade entries):

Having trouble seeing the open positions graphic above? Click here to view it directly on your web browser instead.
open positions:
Below is an overview of all open positions, as well as a report on all positions that were closed only since the previous day’s newsletter. Net P/L figures are based a $100,000 model portfolio. Changes to open positions since the previous report are listed in pink shaded cells below. Be sure to read the Wagner Daily subscriber guide for important, automatic rules on trade entries and exits.

Having trouble seeing the open positions graphic above? Click here to view it directly on your web browser instead.
closed positions:

Having trouble seeing the closed positions graphic above? Click here to view it directly on your web browser instead.
ETF position notes:
- $USO buy entry triggered. Note the new entry price in $FDN, which did not officially trigger for us last Friday due to the 5-minute rule.
stock position notes:
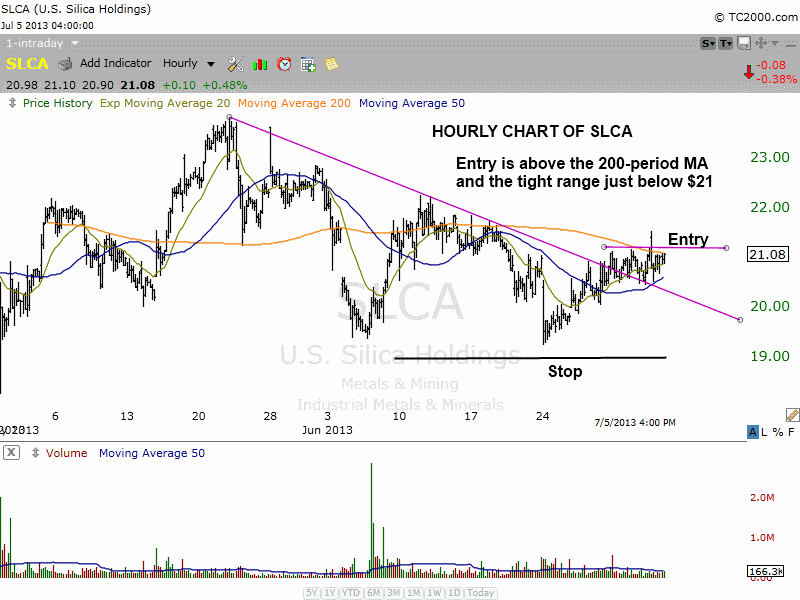
- $SLCA buy setup did not trigger due to the 5-minute rule. Note the new entry price.
ETF, stock, and broad market commentary:
Stocks concluded the holiday-shortened week on a firmly positive note last Friday, as the major indices scored solid gains across the board. The S&P 500, Dow Jones, and NASDAQ each climbed 1.0% and closed at their intraday highs. Total volume in both exchanges was approximately 37% higher than the previous day’s levels; however, the volume comparison is not accurate because the prior session closed three hours early.
Last Friday’s rally pushed each of the major indices back above their respective 50-day moving averages. The reclamation of this key, intermediate-term trend indicator is significant because it points to the bulls regaining the upper hand in the stock market. Big-money players such as banks, mutual funds, hedge funds, and other institutions are also more confident buying stocks when the S&P, Dow, and NASDAQ are all above their 50-day moving averages.
One positive element of recent market action has been the relative strength in small-cap stocks. Unlike the rest of the main stock market indexes, each of which are still trading well below resistance of their May 2013 highs, the small-cap Russell 2000 index has already rallied back to test its recent highs. The index also set a fresh ALL-TIME closing high last Friday. This is shown on the daily chart of iShares Russell 2000 index ETF ($IWM) below:

Keeping an eye on the performance of small-cap stocks during and after market corrections is important because institutional money flow into the small-cap arena indicates an increasing demand for risk among investors. When the stock market is being led by small-cap stocks, new leadership develops in leading stocks, which tends to pull the entire broad market along with it. This is much more positive than having leadership in blue-chip (Dow) stocks, which sometimes indicates a flight to safety.
Throughout the first half of 2013, one of the strongest international ETFs was iShares Japan Index ($EWJ), which cruised 26% higher from the beginning of the year to its May 21 peak. In late May, $EWJ finally entered into a correction that saw the ETF retrace 13% from its May peak down to its June 6 low. However, $EWJ has recovered nicely since then, and is back above both its 20 and 50-day moving averages.
If EWJ rallies above last Friday’s high, it will start to fill a large gap that was formed when the ETF was in correction mode. If that happens, we could easily see $EWJ cruise back to its 52-week high very rapidly. Take a look:

After reviewing our weekend scans, we continue to see solid price and volume acton from the majority of leadership stocks. Although our timing model has yet to produce a buy signal, the leadership portion of the timing model is in good shape, so we are shifting the timing model from sell mode to neutral.
Since $SLCA did not trigger last Friday, it is back on the watchlist for today. Please note the new entry price. The hourly chart below details our entry, which is over the tight hourly range.

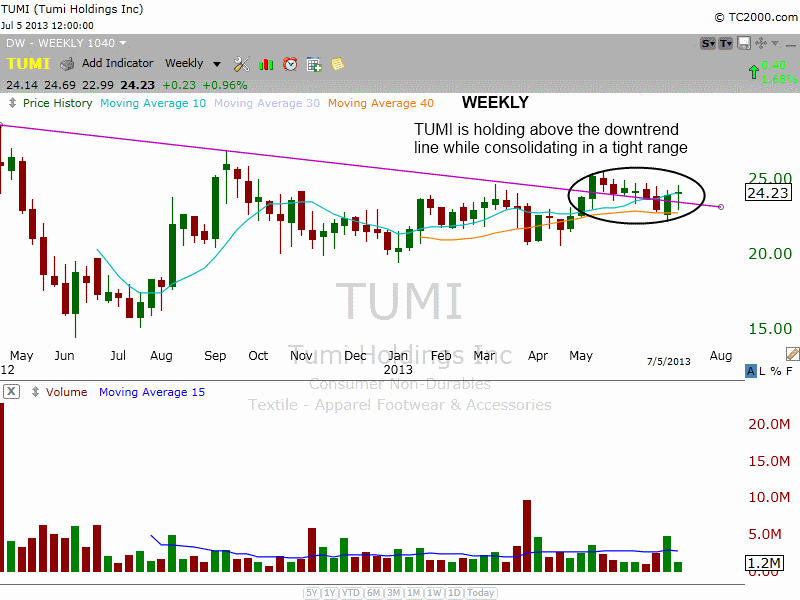
In addition to $SLCA, we also like $TUMI as a buy entry due to a potential downtrend line breakout on mutliple timeframes. The weekly chart below shows the recent breakout above the downtrend line and the tight consolidation that has formed since. Note that the action is also above the 40-week MA and hovering around the 10-week MA.

The daily chart is also setting up for a potential downtrend line breakout, which gives us a breakout on two timeframes (daily & weekly). The stop is just below the low of 7/2, as we’d like to see the action hold above the 50-day MA or 23.50 at the very least.