Current signal generated on close of July 5
Past signals:
- Sell signal generated on close of June 24
- Neutral signal on the close of June 20
today’s watchlist (potential trade entries):

Having trouble seeing the open positions graphic above? Click here to view it directly on your web browser instead.
open positions:
Below is an overview of all open positions, as well as a report on all positions that were closed only since the previous day’s newsletter. Net P/L figures are based a $100,000 model portfolio. Changes to open positions since the previous report are listed in pink shaded cells below. Be sure to read the Wagner Daily subscriber guide for important, automatic rules on trade entries and exits.

Having trouble seeing the open positions graphic above? Click here to view it directly on your web browser instead.
closed positions:

Having trouble seeing the closed positions graphic above? Click here to view it directly on your web browser instead.
ETF position notes:
- No trades were made.
stock position notes:
- Note that we are selling half of $AWAY on the open.
ETF, stock, and broad market commentary:
Stocks concluded Wednesday’s session with mixed results, after the afternoon release of the Fed minutes led to the usual intraday volatility and indecision. Both the S&P 500 and Dow Jones Industrials were flat on the day, but the NASDAQ Composite showed relative strength by gaining 0.5%. Turnover in the NYSE was on par with the previous day’s level, while total volume in the NASDAQ was 4% lighter.
Since recovering off their June 24 lows, the main stock market indexes have been trending steadily higher. For the past several days, all the major indices have been holding firmly above key intermediate term support of their 50-day moving averages as well. However, the S&P, Dow, and NASDAQ may now pause for several days, or pullback slightly, as each index has run into significant horizontal price resistance.
Below are daily charts of the ETF proxies of three popular indexes. Notice the similarities in their chart patterns right now:


As pointed out in our July 8 report, one really positive element of the market right now is the leadership being exhibited by small-cap stocks.
In each of the past four sessions, the small-cap Russell 2000 Index has closed at a fresh all-time high. Again, this is a bullish sign of an increasing appetite for risk among institutional investors. Even though the S&P, Dow, and NASDAQ are still below their prior highs (and at resistance levels), any correction in the broad market is likely to be short-lived due to the leadership in the small-cap arena.

Presently, we have three open ETF positions, each of which is showing an unrealized gain since entry. Here is a quick update on the technical picture of each one.
The recent breakout in US Oil Fund ($USO) has the following through nicely. The ETF has closed higher and six out of the past seven sessions. $USO also jumped 1.8% yesterday, despite an unchanged closing price in the benchmark S&P 500. Trading at a new 52-week high, this ETF continues to act very well.
Like $IWM and the Russell 2000, First Trust DJ Internet Index ($FDN) has set a new all-time closing high in each of the past three sessions. Internets are one of the strongest industry sectors right now, and we are well-positioned to take advantage of further gains in the sector. Even if the broad market pulls back for a few days, we expect $FDN to hold above its breakout level, then resume its upward march shortly thereafter.
Guggenheim Solar ETF ($TAN) has been consolidating for the past several days, but remains above new support of its prior downtrend line. It is also holding above its 20 and 50-day moving averages, both of which are sloping higher. Remember that $TAN was one of the strongest domestic ETFs in the market prior to the recent correction.
As market conditions continue to improve, we plan to add additional stock and ETF exposure to our portfolio.
Both $DDD and $WDAY remain live setups. We also have two new stocks on today’s watchlist in $PDFS and $AMBA. Note that we are selling half of our position in $AWAY on the open due to yesterday’s ugly price and volume action. We are going with a break-even stop on the remaining 100 shares.
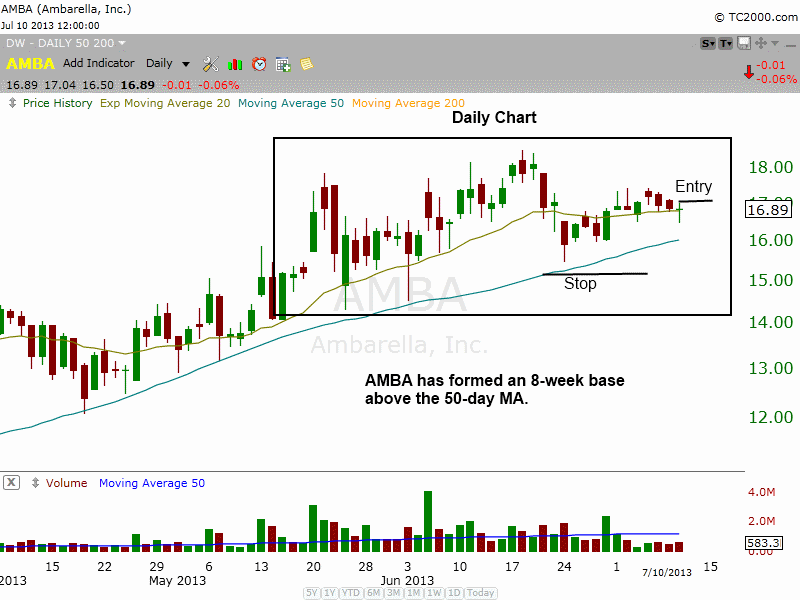
$AMBA formed a reversal candle after undercutting a 4-day low and closed back above the 20-day EMA. Our buy entry is over yesterday’s high. Our stop is pretty loose on this trade (beneath 6/24 low), in case the price action pulls back in to the 50-day MA. Although we would prefer at test of the 50-day MA as a lower risk entry point, we do not want to miss out on $AMBA if it decides to take off. Also, note the dry up in volume and tight trading range over the past six sessions. The light volume is a bullish sign, as it signals that traders are bored with the current action. Boring is good for us, because we know that a volatility contraction should eventually lead to a volatility expansion (breakout).

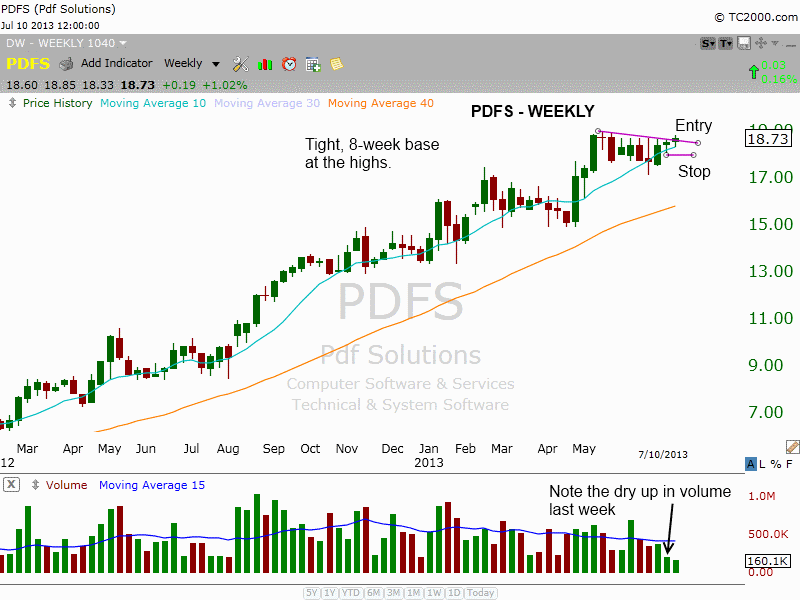
$PDFS has formed a flat base at the highs. Flat bases are shallow corrections of 15% or less, and are typically 5-8 weeks in length. $PDFS has cleared the downtrend line of the consolidation, and is poised to breakout to new highs with a close above the two-day high. Note the dry up in volume last week. As you know, a dry up in volume is a bullish sign. A price and volume contraction is what we always look for when identifying the best basing patterns. Our stop is below the 50-day MA and the low of 7/3. $PDFS’s average daily volume is a bit light, so we reduced the share size.
