Buy Mode
– Timing model generated buy signal on close of March 5 (click here for more details)
Please read commentary (from the April 2 newsletter) regarding the new model portfolio. Stock and ETF positions are now combined in to one simple portfolio.
today’s watchlist (potential trade entries):

Having trouble seeing the open positions graphic above? Click here to view it directly on your web browser instead.
open positions:
Below is an overview of all open positions, as well as a report on all positions that were closed only since the previous day’s newsletter. Net P/L figures are based on two separate $50,000 model portfolios (one for ETFs and one for stocks). Changes to open positions since the previous report are listed in pink shaded cells below. Be sure to read the Wagner Daily subscriber guide for important, automatic rules on trade entries and exits.

Having trouble seeing the open positions graphic above? Click here to view it directly on your web browser instead.
closed positions:

Having trouble seeing the closed positions graphic above? Click here to view it directly on your web browser instead.
ETF position notes:
- No trades were made.
stock position notes:
- Cancelled $MX and $PRLB buy setups. $DK stop triggered and we are out with a small loss.
ETF, stock, and broad market commentary:
A decent bounce in the final 30 minutes of trading prevented the Nasdaq and S&P 500 from generating a clear cut distribution day, as total volume was higher on both exchanges. The past two sessions have been borderline distribution days, and with the distribution count already standing at 4 on both the Nasdaq and S&P 500, it wouldn’t take much more than one more clear distribution day to shift our timing model to a sell signal.
The Dow and S&P 500 continue to push higher, but we are now seeing divergence in small cap stocks with the Russell 2000 breaking support of the 20-day EMA. The breakdown in the Russell is noteworthy because most of the stocks we trade are either small or mid-cap growth stocks.
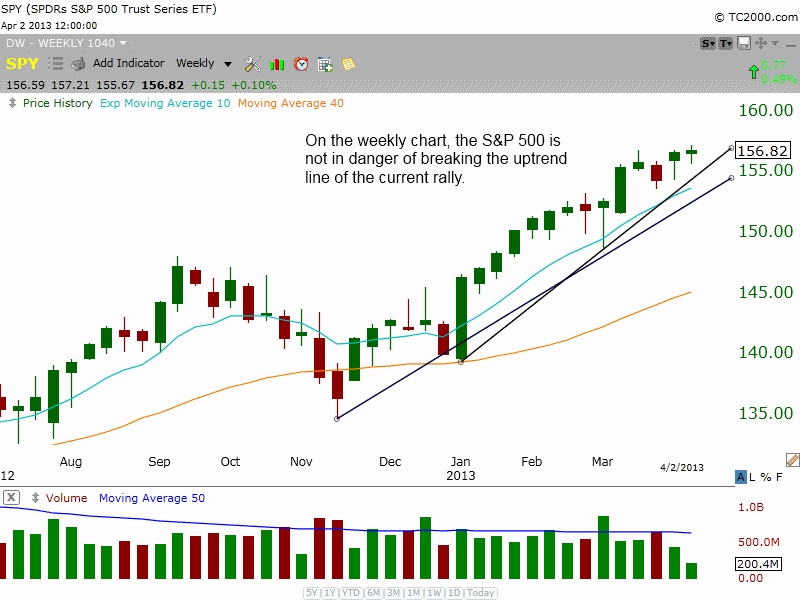
The weekly chart of the S&P 500, which is trading well above the uptrend line of the current rally:
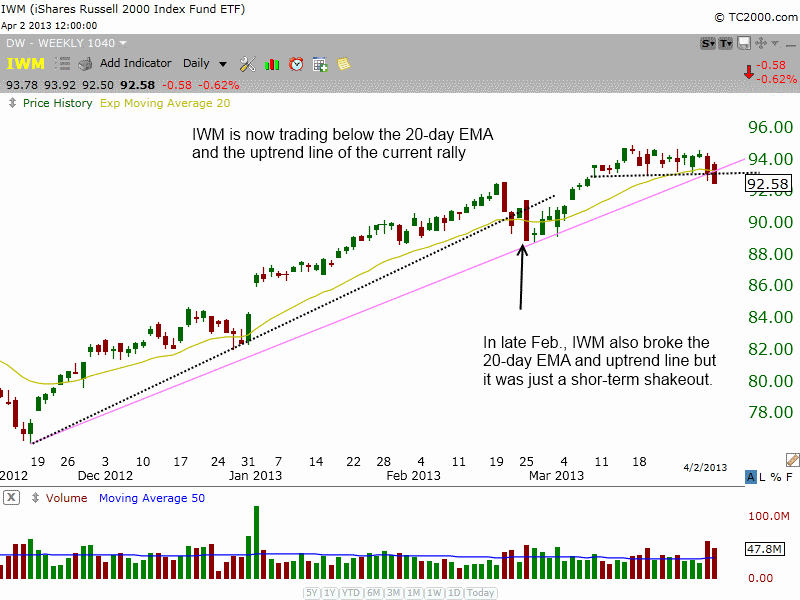
The daily chart of the Russelll 2000 shows the recent weakness, as the price action has broken support at $93, the 20-day EMA, and uptrend line of the current rally.
Using the weekly chart of $IWM, we see two clear support levels around $92 and $90. Please think of support as an area, rather than just a line that must be held to the penny. Stocks and averages can and do undercut support for a few days and bounce right back.
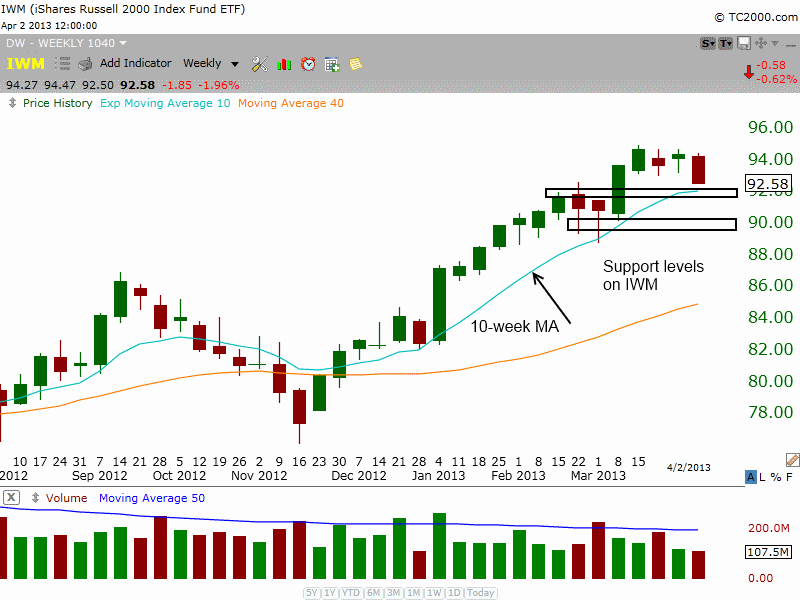
The $92 support level consists of support from a prior resistance level for three weeks in February and the rising 10-week moving average or 50-day moving average. The second level of support is from the swing lows of late January and late February, around $89 – $90.
Taking a look at the bigger picture, we turn to the monthly chart of $IWM and see a clear uptrend line with multiple touches still, which should provide support around $90 (or slightly higher).
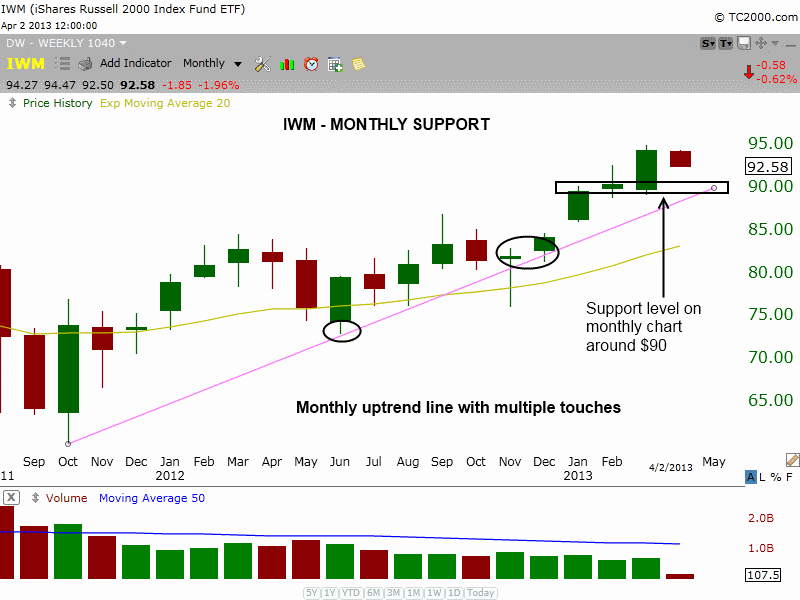
On both the weekly and monthly chart there is clear support at $90. If the price action were to visit this level it would only be a 5% to 6% pullback off the highs of the rally. A shallow 5-6% correction within a bull market would be a bullish sign and could lead to a strong Q3 and Q4 in 2013.
We are not calling the top here in $IWM or the current rally, just pointing out support levels if the price and volume action turns bearish.
Just a quick reminder, please note that we are selling $HCA on the open to lock in a small gain due to Tuesday’s bearish reversal candle. We are also covering $XME on the open to lock in a nice gain in to weakness.
On the stock side, we stopped out of $DK with a smaller than average loss (around -$130). We sold 1/3 of our position in $DK last week near breakeven and raised the stop to just below Monday’s low yesterday. When setups are not working out we try to play as much defense as we can without choking off the position.
The past few days have not been kind to leadership stocks. Most stocks that broke out in late February / early March have run out of steam the past few days and are now in pullback mode. Other stocks that have been forming bullish basing patterns the past few weeks are beginning to break down. Refiners and homebuilders are an example of two groups that have produced some disappointing action the past two weeks. If setups like $PRLB, $URI, $SODA, $AMBA, $ALNY, $DGI, $CHUY, $PHM, $DHI, and $AMZN begin to roll over, along with the market suffering an ugly distribution day, that would be a clear sign that the current rally may be entering a short-term correction.
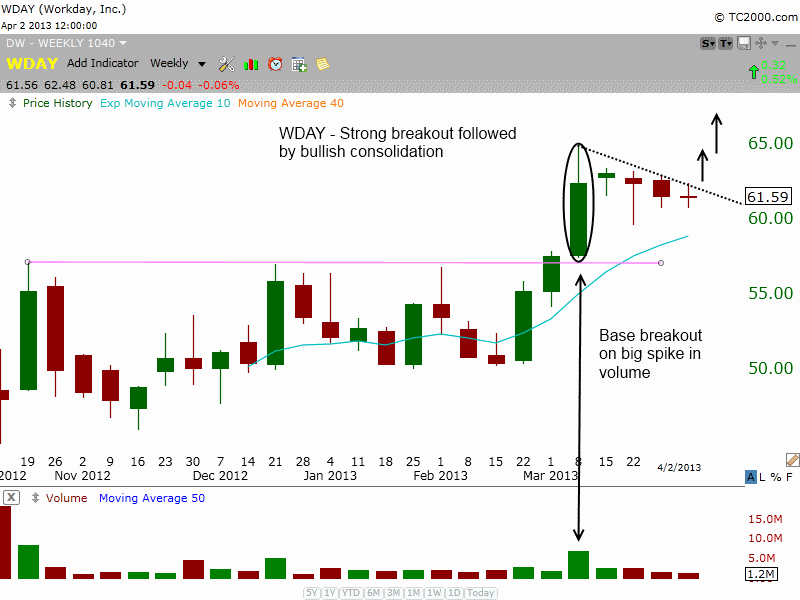
We canceled buy setups in $MX and $PRLB. We are monitoring a few setups if the market holds. One of the better looking setups out there is $WDAY, which is a recent IPO from last October. $WDAY broke out to new highs on big volume in early March, and has formed a tight consolidation over the past few weeks. The setup is not official, but there is a clear buy entry over yesterday’s high + 15 cents, with a tight stop beneath the low of the day it triggers or just below 60.80. Share size should be around the 1/3 to 1/2 of full. So that means if you have a max position size of 20%, then $WDAY should be sized in the 7-10% range.
relative strength combo watchlist:
Our Relative Strength Combo Watchlist makes it easy for subscribers to import data into their own scanning software, such as Tradestation, Interactive Brokers, and TC2000. This list is comprised of the strongest stocks (technically and fundamentally) in the market over the past six to 12 months. The scan is updated every Sunday, and this week’s RS Combo Watchlist can be downloaded by logging in to the Members Area of our web site.