market timing model:
Buy – Signal generated on the close of August 16 (click here for more details)
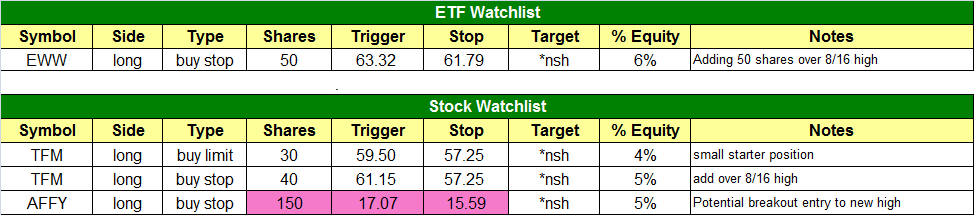
today’s watchlist (potential trade entries):
Having trouble seeing the open positions graphic above? Click here to view it directly on your web browser instead.
open positions:
Below is an overview of all open positions, as well as a report on all positions that were closed only since the previous day’s newsletter. Net P/L figures are based on two separate $50,000 model portfolios (one for ETFs and one for stocks). Changes to open positions since the previous report are listed in pink shaded cells below. Be sure to read the Wagner Daily subscriber guide for important, automatic rules on trade entries and exits.

Having trouble seeing the open positions graphic above? Click here to view it directly on your web browser instead.
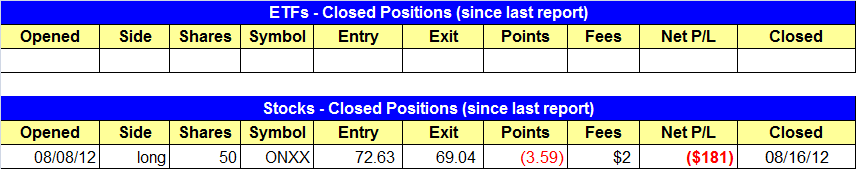
closed positions:
Having trouble seeing the closed positions graphic above? Click here to view it directly on your web browser instead.
ETF position notes:
- EWW triggered its buy entry and we are long 50 shares. We added EWW to the watchlist again today with another buy entry for 50 shares above Thursday’s high.
stock position notes:
- ONXX triggered our stop and we closed the position for a $180 loss. Not all of our setups work so it is very important to obey risk management and cut positions at predetermined levels. Also, please note that our winning trade in CBM was +$400 and our losing trade in ONXX was $180. We always want to around the 2 to 1 level on the winners vs losers (when we can). We don’t always get there, but it is what we strive for at the very least.
- EQIX pullback entry triggered and we are now long 40 shares.
ETF and broad market commentary:
The broad market averages posted a solid day of gains accross the board on a pick up in volume, closing in the top 20% of the day’s range. The small-cap Russell 2000 Index ($RUT) led the way with a 1.1% gain. The Nasdaq Composite Index ($COMPQ) rose a solid 1.0% with the S&P 400 Midcap Index ($MID) just behind at 0.9%. The S&P 500 Index ($SPX) picked up 0.7%, and the Dow Jones Industrial Average ($DJIA) rallied 0.6%. Small cap stocks are finally beginning to wake up which is a good sign for our stock trading sytem, which is focused on small and midcap growth stocks that are trading at/near 52-week highs.
Turnover was higher on both exchanges, registering a bullish accumulation day for both the Nasdaq Composite and the S&P 500. Volume jumped a healthy 27% on the Nasdaq and 17% on the NYSE. Total volume was also well above average on the Nasdaq. The ADV/DEC volume ratio was solid at 3 to 1 on the NYSE but only 2 to 1 on the Nasdaq. Overall it was positive a positive day with strong volume confirming the day’s advance. With the Nasdaq up 1% on heavy volume, we can now shift the timing model in to buy mode. However, until the timing model shifts to confirmed buy mode we will continue to operate conservatively and avoid using margin.
With the market pushing higher we are looking for breadth to expand to confirm the market advance and we are beginning to see that with small cap stocks waking up. Another tool we use to monitor the breadth is a simple chart of stocks making new 52-week highs minus stocks making new 52-week lows. The chart below shows Nasdaq New Highs vs. New Lows. Note that the lines are going in the right direction, with 52-week highs (blue line) putting in higher lows and poised to breakout above the prior swing highs. The 52-week lows line (red line) is setting lower highs and poised to breakdown beneath the summer lows.

The iShares DJ US Home Contruction (ITB) broke out Thursday on a pick up in volume after a tight ranged consolidation. We are monitoring the action for a potential pullback scenario, where ITB runs up for a few days and then pulls back over three to seven bars. Contrary to what most traders believe, when we buy on a pullback the goal is to not to guess the bottom or buy at the cheapest price. The goal is to buy at the right time by patiently waiting for support to come in and for a low-risk buy point to develop.
")
EWW triggered on the long side yesterday. We plan to add more shares over Thursday’s high with the same stop that is listed in the open positions section. We are focused on increasing our long exposure as long as proper buy setups emerge.
stock commentary:
$TFM has been added to the watchlist. Note that one entry is on a pullback (buy limit) and the other is on a breakout (buy stop). The 8/13 reversal candle is serving as our reference point for a stop. With the price action trading above the high of that candle, we feel that we can at least take partial size (if it pulls back) and add the rest above the three day high.
We added to EQIX on a pullback yesterday and adjusted our buy price and share size in the open positions section. Let’s see if we can get some follow through to the upside over the next two weeks. Overall, we are happy with current market conditions but would like to see more powerful breakouts emerge in numbers to give us the confidence to get heavily long.
If you are a new subscriber, please e-mail [email protected] with any questions regarding our trading strategy, money management, or how to make the most out of this report.
relative strength combo watchlist:
Our Relative Strength Combo Watchlist makes it easy for subscribers to import data into their own scanning software, such as Tradestation, Interactive Brokers, and TC2000. This list is comprised of the strongest stocks (technically and fundamentally) in the market over the past six to 12 months. The scan is updated every Sunday, and this week’s RS Combo Watchlist can be downloaded by logging in to the Members Area of our web site.