Current signal generated on close of August 15.
Portfolio long exposure can be anywhere from 30% to 100% (if your stocks are holding up).
Past signals:
- Buy signal generated on close of July 11
- Neutral signal generated on close of July 5
- Sell signal generated on close of June 24
today’s watchlist (potential trade entries):

Having trouble seeing the open positions graphic above? Click here to view it directly on your web browser instead.
open positions:
Below is an overview of all open positions, as well as a report on all positions that were closed only since the previous day’s newsletter. Changes to open positions since the previous report are listed in pink shaded cells below. Be sure to read the Wagner Daily subscriber guide for important, automatic rules on trade entries and exits. Click here to learn the best way to calculate your share size.

Having trouble seeing the open positions graphic above? Click here to view it directly on your web browser instead.
closed positions:
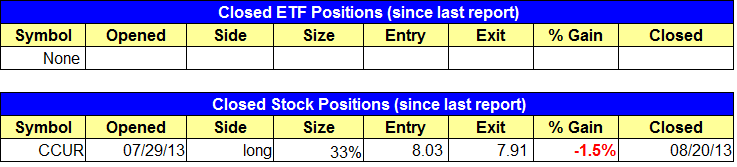
Having trouble seeing the closed positions graphic above? Click here to view it directly on your web browser instead.
ETF position notes:
- Please Note that we lowered the entry price in the $AGQ buy setup.
stock position notes:
- Sold remaining shares of $CCUR at our stop price and bought $KORS.
ETF, stock, and broad market commentary:
Stocks finally ended a four day losing streak on Tuesday, but the averages were all over the place in terms of performance. Small and mid-cap stocks lead the way, closing near the highs of the day with gains of over 1.2%, while the Dow Jones closed slightly negative on the session. The NASDAQ Composite and the S&P 500 were in the middle, with gains of 0.7% and 0.4% respectively.
With small and mid-cap stocks reclaiming the 50-day MA, the S&P 500 and Dow Jones are the lone holdouts still trading below our technical line in the sand during a bull market. The diverging technical action in major averages suggests that the market may needs a few more weeks of rest. However, as you know, we shy away from predictions and prefer to take it one day at a time.
The next two weeks will be quite interesting for large cap NASDAQ stocks like $AMZN, $GOOG, and $PCLN, as they attempt to hold or reclaim important support levels. With $AMZN breaking the 50-day MA last week, we’d like to see the price action hold above $280, which is just below the highs of the last base. If these key stocks begin to breakdown along with leaders like $LNKD, $TSLA, and $KORS, then we will know that it is time to move into cash and or begin establishing short positions.
After an ugly gap down from a false breakout to new swing highs on 8/7, the Guggenheim Solar ETF ($TAN) is trying to hold the 50-day MA or 10-week MA on the daily chart. If the price action can hold above the $25 – $26 level, then we may look to add back the shares we stopped out of last week. Ugly selling action in First Solar Inc ($FSLR) has been a drag as of late, as it carries a 10% weighting in $TAN. We’d like to see $FSLR at the very least hold above the 200-day MA over the next two weeks.

Like $IHI, the iShares Dow Jones US Medical Devices ETF ($IHI) has been in pullback mode after gapping down below the 20-day EMA last week. So far the price action has held the 10-week MA on the weekly chart or 50-day on daily chart. On the weekly chart below, there is support from the rising 10-week MA and the highs of the last base. If this level continues to hold, then we will look to re-enter within the next few days.

On the stock side, $KORS triggered a buy entry for us as it moved through the high of Monday’s bullish reversal candle. Although it may take some time to get going, we believe that $KORS has the potential to rip higher provided that the market does not breakdown below the 50-day MA over the next few weeks.
After printing a bullish reversal candle last Friday, $YELP has traded in a very tight range the past two days on light volume just below the 10-day MA. A very light volume consolidation day is usually a sign that the current pullback may be over and that the uptrend is ready to resume. If $YELP can clear the three-day high, then we look for the price action to consolidate for another week or two while forming higher swing lows within the base. In this scenario, last Friday’s low should end up being the low of the current pullback. Please note that we bumped the share size back up to 33% in $YELP.
