Confirmed Buy– The timing model was upgraded to a confirmed buy on the close of January 22. However, the initial buy signal was generated on the close of December 31. (click here for more details)
today’s watchlist (potential trade entries):

Having trouble seeing the open positions graphic above? Click here to view it directly on your web browser instead.
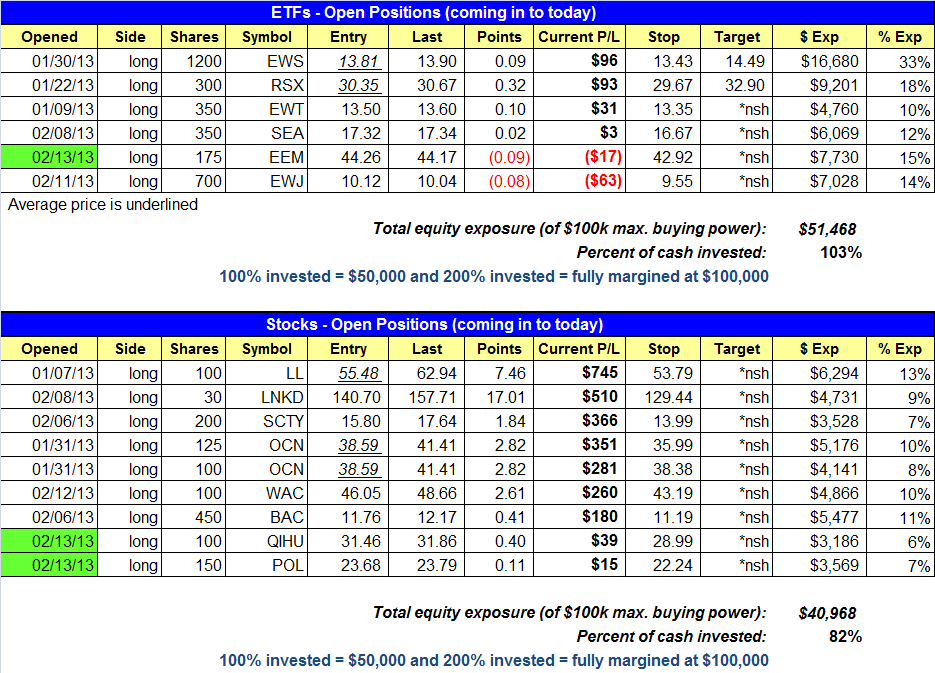
open positions:
Below is an overview of all open positions, as well as a report on all positions that were closed only since the previous day’s newsletter. Net P/L figures are based on two separate $50,000 model portfolios (one for ETFs and one for stocks). Changes to open positions since the previous report are listed in pink shaded cells below. Be sure to read the Wagner Daily subscriber guide for important, automatic rules on trade entries and exits.
Having trouble seeing the open positions graphic above? Click here to view it directly on your web browser instead.
closed positions:
Having trouble seeing the closed positions graphic above? Click here to view it directly on your web browser instead.
ETF position notes:
- $EEM buy setup triggered. We canceled both $INP and $EWJ setups.
stock position notes:
- $QIHU and $POL buy setups triggered.
ETF, stock, and broad market commentary:
After getting off to a positive start yesterday, stocks ran into volatility that led to a choppy, indecisive session of trading. By the closing bell, stocks closed with mixed results, but near the middle of their intraday trading ranges. Small and mid-cap stocks continue to lead the market higher, extending from a short-term breakout last Friday. The S&P 500 has stalled a bit the past two sessions, but has done so on lighter volume, which is fine. Turnover rose slightly on the Nasdaq as it closed off the highs of day, signaling a bit of “churning”.
Overall, the market uptrend remains healthy with no serious signs of selling. Rather than trying to predict where the rally will end, we prefer to focus on the setups and let the market tell us when to exit.
We added on new position to the ETF portfolio yesterday in $EEM. $INP false triggered on the open, with just a few hundred shares printing above our 60.68 buy stop at 60.73. For those who were triggered, please sell $INP on the open for a small loss. We are cancelling the $INP trade setup for now, but we will continue to monitor the action for a bullish reversal candle at or around the 50-day MA on the daily chart. We also cancelled the buy stop to add to our position in $EWJ.
Solar stocks have made a comeback the past few months, with $FSLR leading the way and $SCTY, $WFR, and $JKS exploding higher as well. The Guggenheim Solar ETF ($TAN) is heavily weighted in leading solar stocks from the United States and China. Recently, $TAN has reversed a long-term downtrend and is beginning to show classic signs of a bullish trend reversal. On the weekly chart below, the 10-week MA has crossed above the 40-week MA, which is a bullish moving average crossover signal.

On the daily chart, $TAN broke out above a month long base on Wednesday, but closed near the lows of the session. If $TAN turns into a false breakout and pulls back in for 3-5 days, then we might be able to grab a low-risk buy entry off support of the rising 20-day EMA, around the 18.40 – 18.50 level.

On the stock side, we added $POL and $QIHU to the portfolio. We now have 8 long positions, which is two shy of our max limit of 10.
$SCTY sold off after a failed morning gap up, but most of the damage was limited to the morning session, as it basically chopped around the rest of the day. Had $SCTY sold off and closed below Tuesday’s low on higher volume (bearish engulfing candle), then we would have raised the stop to protect gains. Since the price action held up (just barely), we are willing to give the action a few days to get back on track.
We have one new buy setup in $EXP, which has formed a tight-ranged consolidation just off the 52-week high. Volume dried up on several days within the base, which is a bullish sign (note the light volume on 1/18, 1/22, 1/29, 2/4 and 2/8).

$EXP is the clear leader of the group (VMC, TXI, and CX are also strong). Note the great relative strength ranking of 97 and top 5% composite ranking of 95 from IBD (Investors Business Daily). Earnings are not due out until May.
If you are a new subscriber, please e-mail [email protected] with any questions regarding our trading strategy, money management, or how to make the most out of this report.
relative strength combo watchlist:
Our Relative Strength Combo Watchlist makes it easy for subscribers to import data into their own scanning software, such as Tradestation, Interactive Brokers, and TC2000. This list is comprised of the strongest stocks (technically and fundamentally) in the market over the past six to 12 months. The scan is updated every Sunday, and this week’s RS Combo Watchlist can be downloaded by logging in to the Members Area of our web site.