Current signal generated on close of June 24
Past signals:
- Neutral signal on the close of June 20
- Buy signal on the close of June 13
- Neutral signal on close of June 12
- Buy signal on the close of April 30
today’s watchlist (potential trade entries):

Having trouble seeing the open positions graphic above? Click here to view it directly on your web browser instead.
open positions:
Below is an overview of all open positions, as well as a report on all positions that were closed only since the previous day’s newsletter. Net P/L figures are based a $100,000 model portfolio. Changes to open positions since the previous report are listed in pink shaded cells below. Be sure to read the Wagner Daily subscriber guide for important, automatic rules on trade entries and exits.

Having trouble seeing the open positions graphic above? Click here to view it directly on your web browser instead.
closed positions:

Having trouble seeing the closed positions graphic above? Click here to view it directly on your web browser instead.
ETF position notes:
- No trades were made.
stock position notes:
- No trades were made.
ETF, stock, and broad market commentary:
Stocks gapped higher on the open but failed to follow through, as most broad market averages pulled back to or near the prior day’s close in the first half hour of trading. Shaking off the weak open, stocks eventually pushed higher for most of the day, but the action was not very impulsive. The Midcap S&P 400 was the biggest gainer on the day at +1.2%, with the S&P 500 and NASDAQ trailing at +1.0% and +0.8% respectively. Volume was lighter on both exchanges, indicating that institutions were not actively buying.
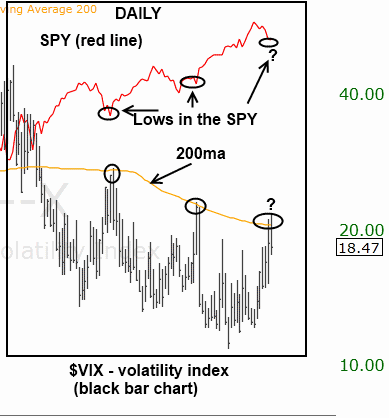
Monday’s selloff in the major averages sent the $VIX (volatility index) to the 200-period MA on the weekly chart (orange line on the chart below). The $VIX measures fear in the market and goes up when the market goes down. So when the $VIX spikes, investors are fearing the worst, so it can be used as a secondary tool to help identify market bottoms (contrarian). Notice that the last two touches coincided with a significant low in the SPY (red line). Will the current touch produce the same outcome?
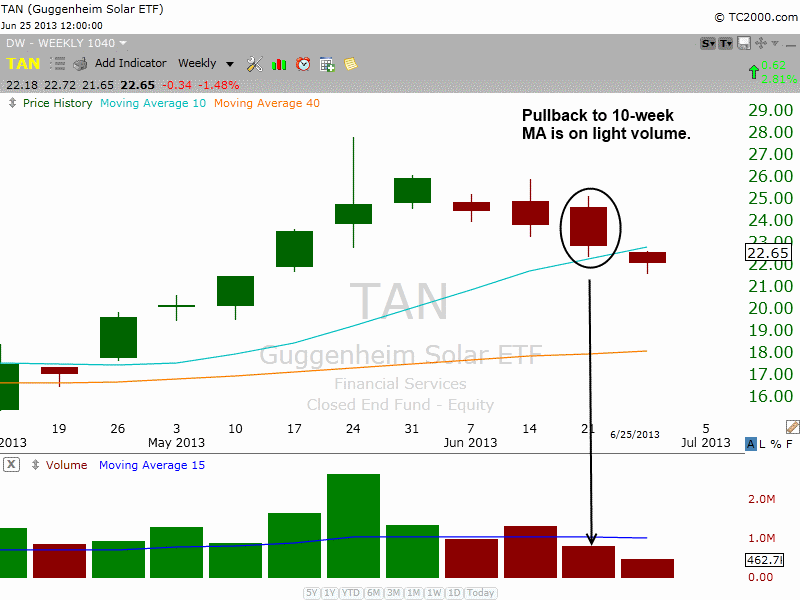
After a strong thrust up in April and May, the Claymore/MAC Global Solar Index ($TAN) has pulled back on light volume to the 10-week moving average. The first pullback to the rising 10-week MA (almost the same as the 50-day MA on the daily chart) is often a low risk entry point in a strong uptrend. Note the light volume last week on the pullback to the 10-week MA on the weekly chart below. A dry up in volume during the base is a good sign, indicating that investors are looking to put their money to work elsewhere.
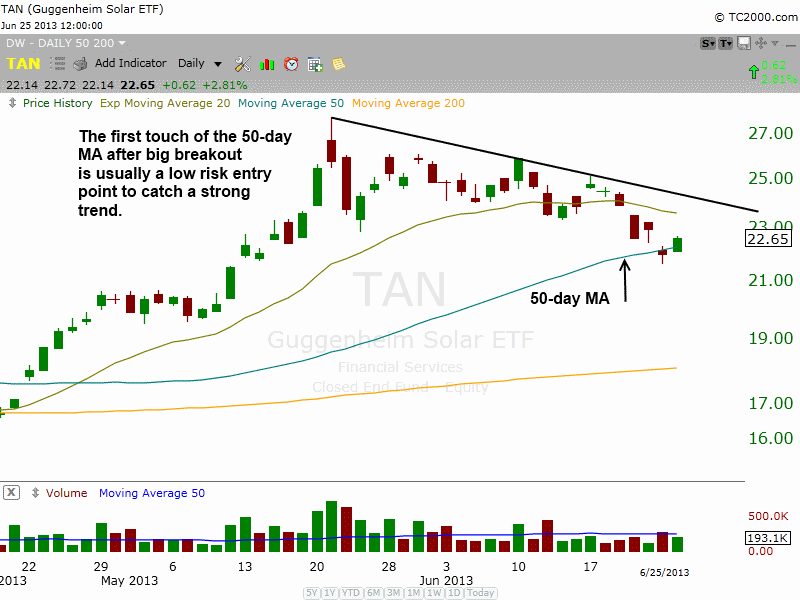
We are placing $TAN on the official watchlist as a buy limit order to capture a slight pullback to the 50-day MA. We will look to add to the position if the price action can form a higher low above the 50-day MA, or on a break of the downtrend line of the consolidation. We are going with a fairly wide stop to give the setup some breathing room, but the price action should hold at or around the 50-day MA minus one or two shakeout candles over the next few weeks.
$AWAY finally got going yesterday, breaking the weekly downtrend line on heavy volume. The stop remains the same for now, but we’d like to see the price action hold above the 500-day MA over the next few weeks, especially if the major averages are able to find some traction.
While our timing model is on a sell signal, the leading stock portion of the model has stabilized. If broad market conditions can settle down this week and leading stocks put in higher lows, then we could potentially see some decent buy setups develop in our scans over the weekend.
Two potential buy setups we are carefully monitoring are:
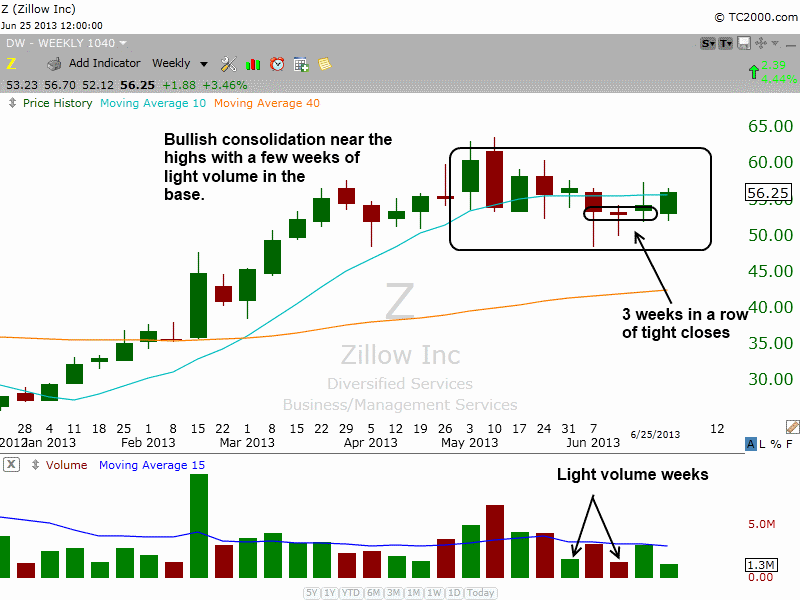
Zillow – $Z (recent IPO)
After a false breakout to new highs in early May, $Z has formed a bullish base over seven weeks, with volume drying up within the base nicely in two of those weeks. We look for the price action to tighten up at or slightly above the 50-day MA over the next few weeks.
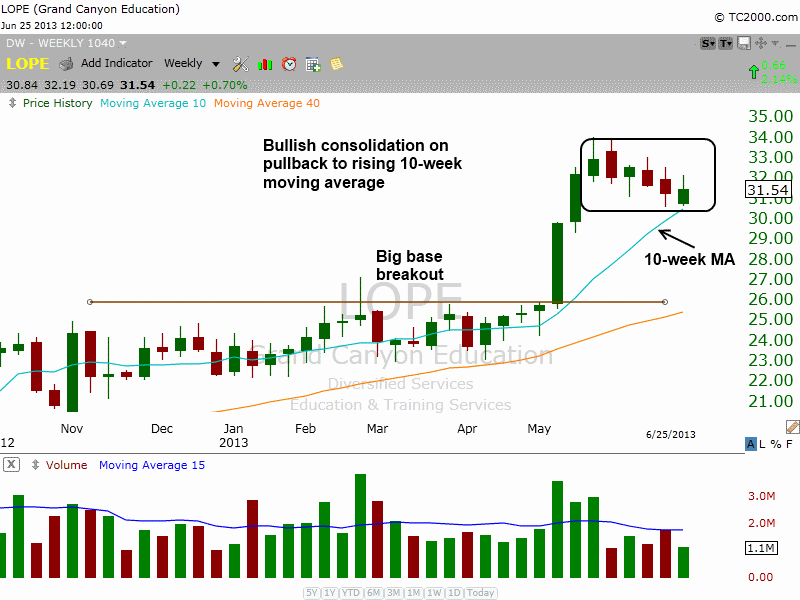
Grand Canyon Education – $LOPE
$LOPE recently broke out from a long consolidation and has been in pullback mode the past five weeks. After a breakout from a lengthy base, strong stocks tend to consolidate in a shallow, five-to-seven week (flat) base after a significant run up. With strong fundamentals and a relative strength ranking of 91, $LOPE is a strong candidate to break out to new highs once market conditions settle down.
