Current signal generated on close of Feb. 13.
Portfolio exposure can be anywhere from 50% to 100% long (or more), depending on how open positions have held up.
Past signals:
- Sell signal generated on close of February 3.
- Neutral signal generated on close of January 24.
- Buy signal generated on close of November 13
- Buy signal generated on close of September 9
- Neutral signal generated on close of August 15
- Buy signal generated on close of July 11
- Neutral signal generated on close of July 5
- Sell signal generated on close of June 24
today’s watchlist (potential trade entries):

Having trouble seeing the open positions graphic above? Click here to view it directly on your web browser instead.
Below is an overview of all open positions, as well as a report on all positions that were closed only since the previous day’s newsletter. Changes to open positions since the previous report are listed in pink shaded cells below. Be sure to read the Wagner Daily subscriber guide for important, automatic rules on trade entries and exits.

Having trouble seeing the open positions graphic above? Click here to view it directly on your web browser instead.
closed positions:
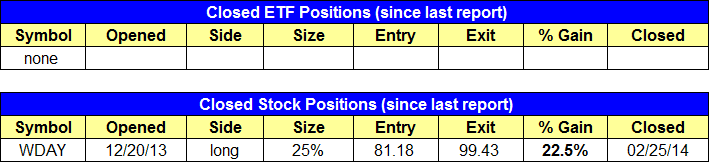
Having trouble seeing the closed positions graphic above? Click here to view it directly on your web browser instead.
ETF position notes:
- $EDZ buy entry triggered. Note that we plan to add to the position on slight weakness with a buy limit order.
stock position notes:
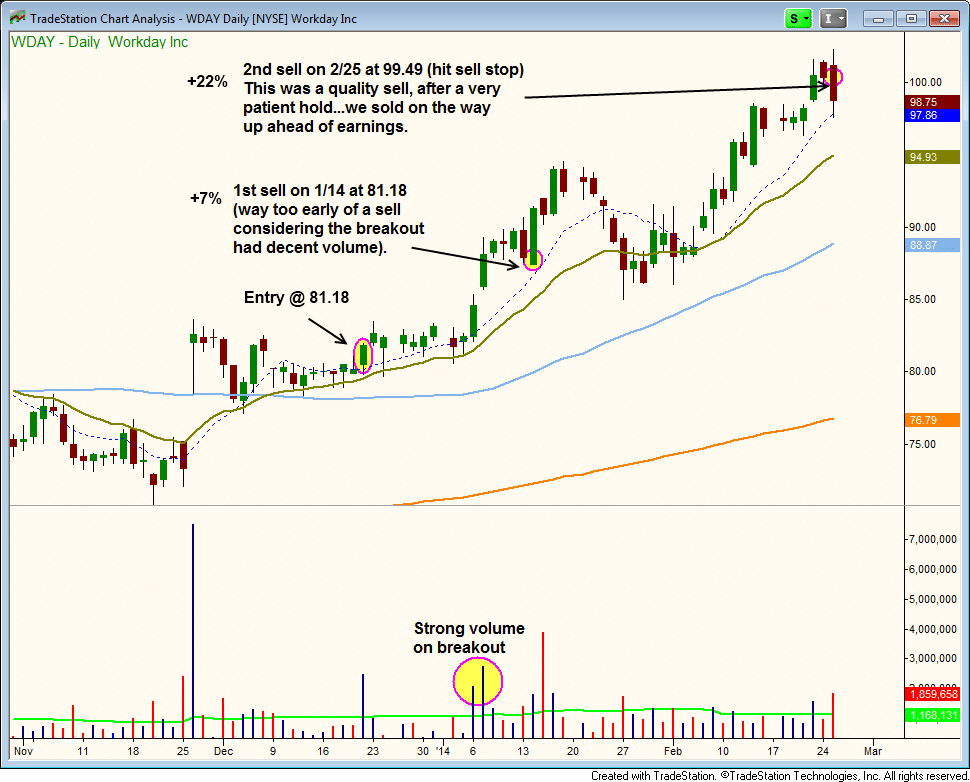
- Sold $WDAY for a 22% gain.
ETF, stock, and broad market commentary:
Stocks closed in negative territory on Tuesday with small losses across the board in the major averages. Although it was an uneventful day for the averages, it was an explosive day for one of our stock holdings, as $TSLA ripped 16% higher on big volume. We remain long from our December 31 entry at $148.76, which is now showing an unrealized gain of +66%.
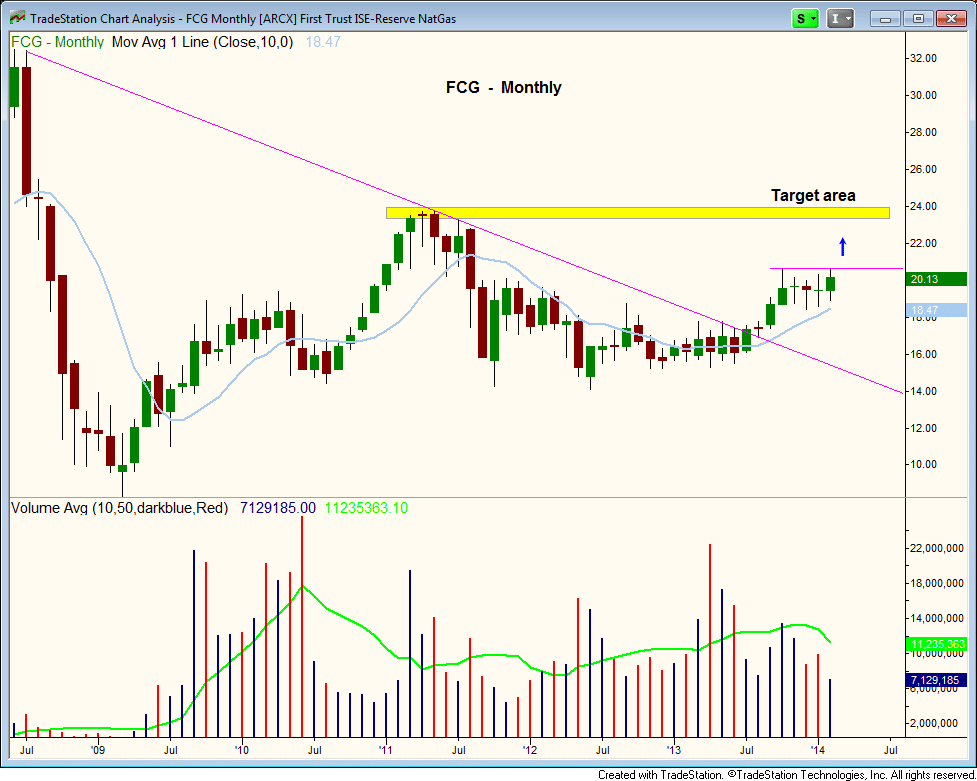
Natural Gas Index ETF ($FCG) continues to form a bullish pattern on the daily chart, finding support off the 10-day MA and closing off the lows of the session on Tuesday. We look for the action to hold above the rising 20-day EMA as it consolidates before breaking out to new 52-week highs.
The target area for $FCG is around $23, which is the prior high of 2011 on the monthly chart below. Note the tight price action the past few months as $FCG held above the rising 10-month MA.
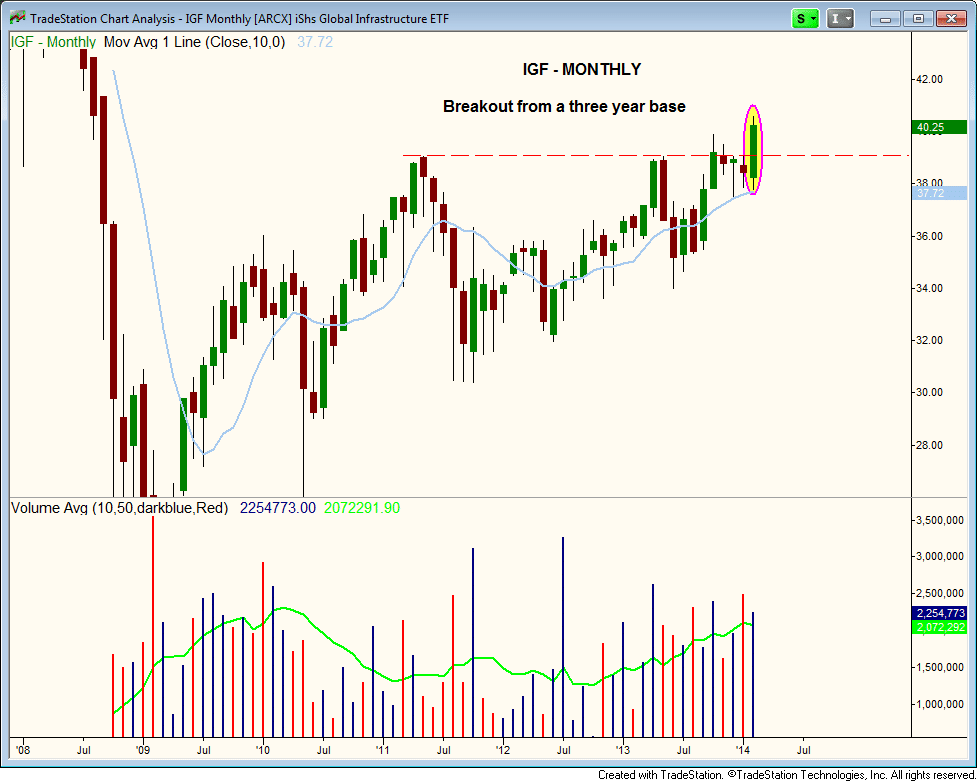
iShares S&P Global Infrastructure Index ($IGF) recently broke out from a three-year long consolidation after tightening up from November to January, just above the rising 10-month MA.
There are three more days of trading left before the end of the month, so assuming that the action holds up, then $IGF will have a confirmed breakout on the daily, weekly, and monthly charts.
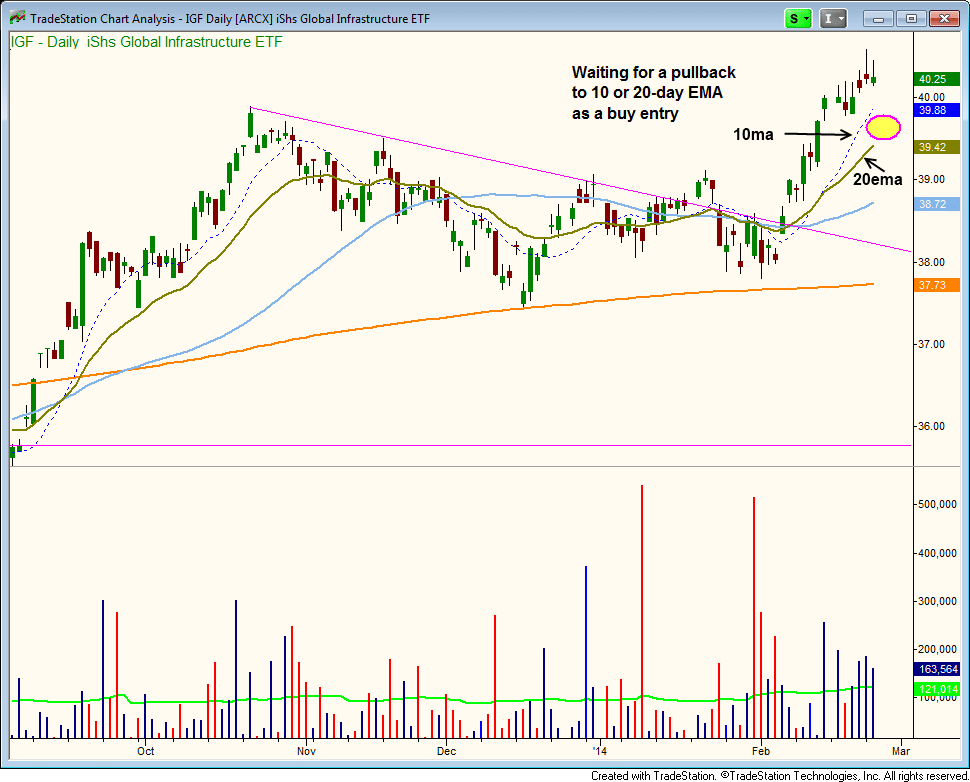
The daily chart of $IGF is extended in the short term, so we must wait for a low risk entry point to develop. A three to five bar pullback to the 10 or 20-day EMA is ideal. At the very least, we’d like the price action to hold above the rising 20-day ME minus a shakeout bar or two.
Most current open positions on the ETF side are in decent shape except for $BDCL, which broke down on heavy volume Tuesday. Although the selling was ugly, we are giving the action a chance to reverse by the end of the week.
Our short position in emerging markets triggered on Tuesday with (inverted ETF) $EDZ clearing $46. The price action followed through nicely and on a pick up in volume. We’d like to add to the position on short-term weakness (see trade details above).
On the stock side, we stopped out of the remaining half position in $WDAY for a +22% gain. We sold the first half of the position way too early back in January, especially since volume was strong on the breakout. When breakout volume is strong it usually pays to be patient with the price action. However, we did manage to get the second half of the trade right, with a very patient hold and sell into strength ahead of this week’s earnings report.
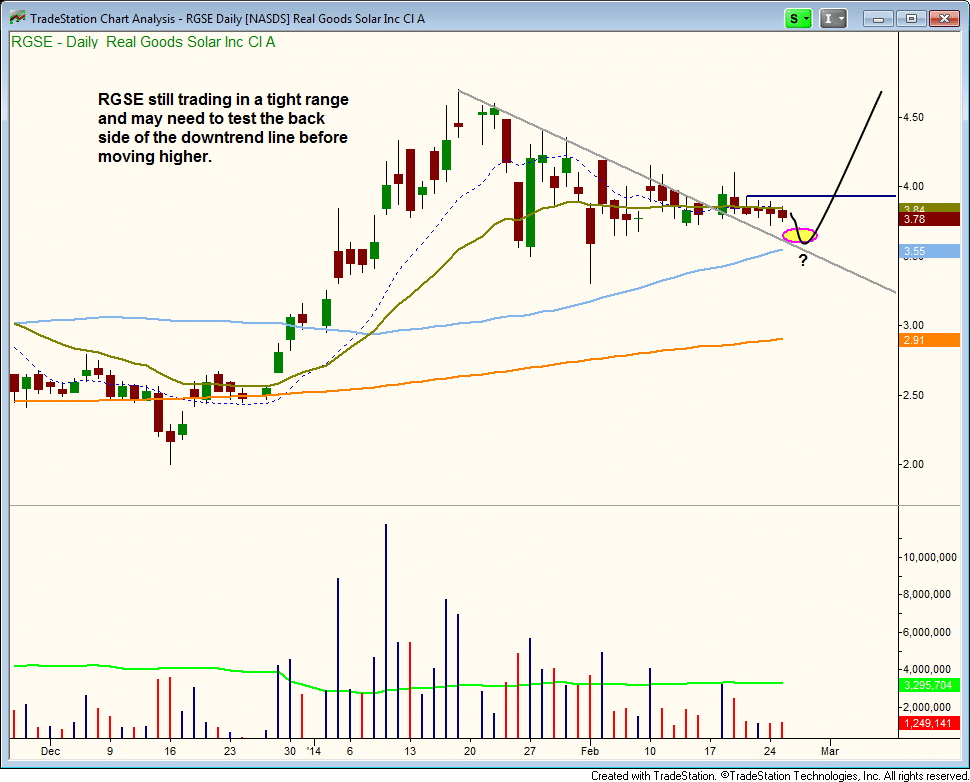
$RGSE (formerly $RSOL) has yet to move since our entry, but the price pattern remains bullish. We could potentially see a short-term dip to test the backside of the downtrend line within the next few days. If the test is successful, then we would expect an eventual breakout above $4.
$SCTY reacted favorably to Monday’s earnings report, closing at new highs on big volume.
$TSLA exploded higher from an upgrade. Tuesday’s big move may have produced a short-term top in $TSLA, as it may need a few weeks to digest a 40% move during the past four weeks. We have no reason to exit any portion of the current trade and will look for a low risk entry point to add to the position.