market timing model: BUY
Current signal generated on close of November 13.
Portfolio exposure can be anywhere from 50 to 100% long. If positions are holding up well, then one can add exposure beyond 100%.
Past signals:
- Neutral signal generated on close of November 6.
- Buy signal generated on close of September 9
- Neutral signal generated on close of August 15
- Buy signal generated on close of July 11
- Neutral signal generated on close of July 5
- Sell signal generated on close of June 24
today’s watchlist (potential trade entries):

Having trouble seeing the open positions graphic above? Click here to view it directly on your web browser instead.
open positions:
Below is an overview of all open positions, as well as a report on all positions that were closed only since the previous day’s newsletter. Changes to open positions since the previous report are listed in pink shaded cells below. Be sure to read the Wagner Daily subscriber guide for important, automatic rules on trade entries and exits.

Having trouble seeing the open positions graphic above? Click here to view it directly on your web browser instead.
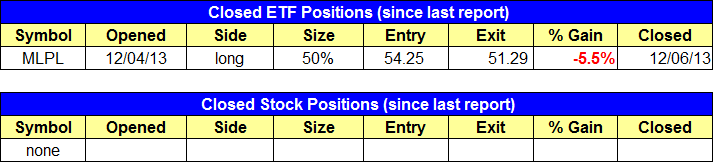
closed positions:
Having trouble seeing the closed positions graphic above? Click here to view it directly on your web browser instead.
ETF position notes:
- No ETFs officially triggered due to the 5-minute rule. $MLPL sell stop triggered and we are out.
stock position notes:
- $SLCA, $KNDI, and $HOLI buy entries triggered.
ETF, stock, and broad market commentary:
Stocks gapped significantly higher on Friday in reaction to the November jobs report. Aside from the Dow Jones extending higher in the afternoon, most averages finished the session near the day’s open.
Friday’s close put the Dow Jones back above the 10 and 20-day moving averages (joining all other major averages). The NASDAQ 100 was the only major average to establish a new swing high.
Volume was light on both exchanges. However, there is clearly enough bullish momentum in the market right now, so we are much more concerned with heavy volume down days than light volume up days.
Our current long position in Financial Bull 3x ($FAS) jumped off support of the 20-day EMA on Friday, after pulling back to a prior swing high from Oct. 22. If $FAS is unable to break out to new highs this week, then it should at the very least continue to set higher swing lows along the way.
There are no new buy setups on today’s ETF watchlist, but both setups from Friday’s watchlist in ($SKYY) and ($QCLN) remain intact.
iShares MSCI South Korea Index Fund ($EWY) is on our internal watchlist as a potential breakout on multiple time frames (daily, weekly, and monthly charts), but the daily chart has yet to present us with a low risk entry point.
The daily chart below shows the recent bullish crossover signal when the 50-day MA crossed above the 200-day MA. Note that the 200-day MA is beginning to rise as well.
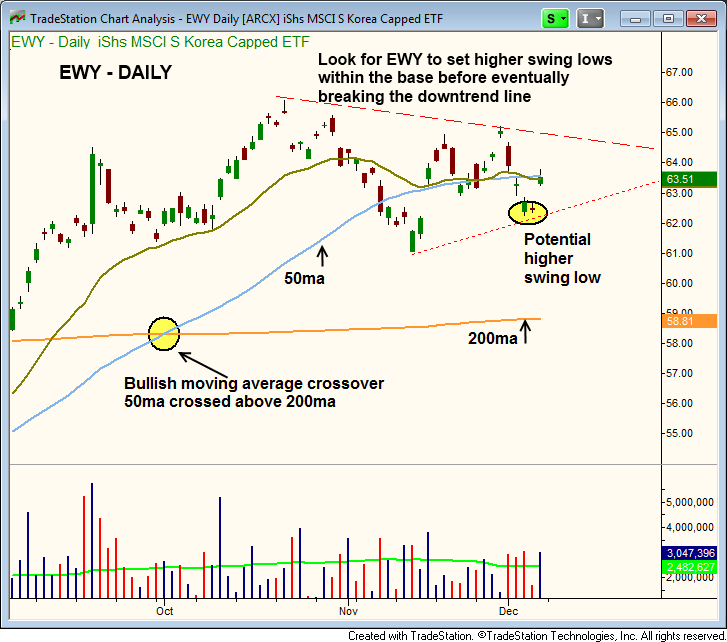
We’d like to see the price action tighten up around the 50-day MA over the next week or two to present us with a low risk entry point. EWY is attempting to set its first higher swing low since pulling back in off the swing high in October.
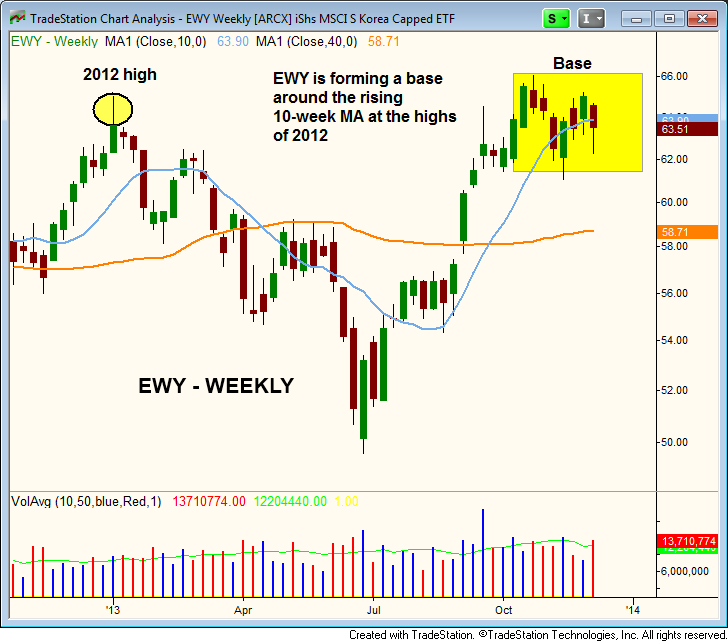
The weekly chart shows the current base which has formed right at the highs of 2012. The current base is seven weeks old, and for the most part has held above the 10-week MA. A breakout from a base of seven weeks should produce enough momentum to take out the highs of 2012.
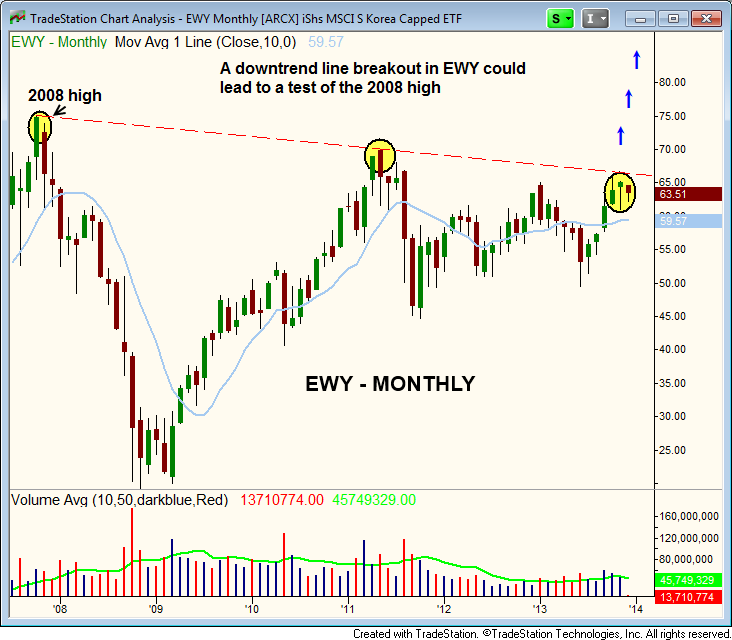
The monthly chart shows the tight price action of the past few months. A breakout above $66 should lead to a test of the 2011 high at $70, and potentially a test of the 2008 high at $75.
Stocks $SLCA, $HOLI, and $KNDI triggered on Friday. We have one new buy setup in $BLMN today, which recently false broke out to new highs.
The pullback has retraced about 12% off the high, shaking out many stops along the way. The price action has settled down the past two day’s at the 50-day MA.
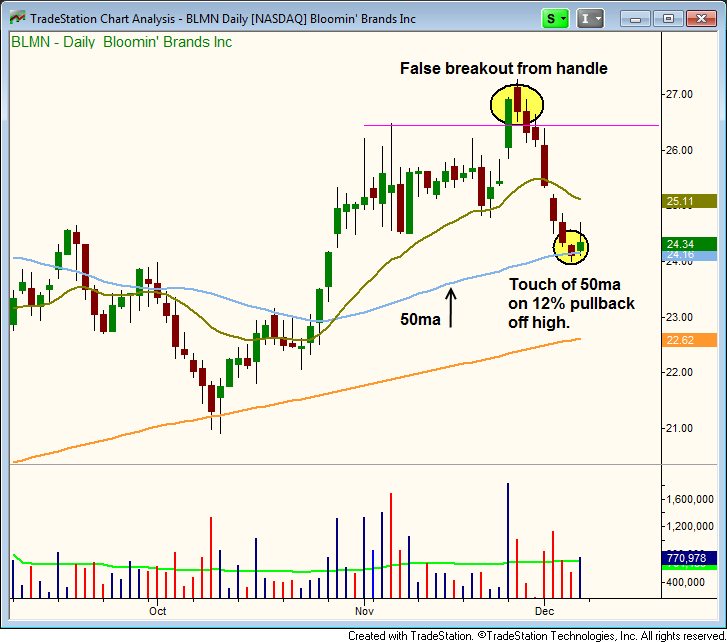
We are looking for support to hold at the 50-day MA over the next few days. $BLMN does have solid fundamentals with a 96 EPS ranking on IBD, as well as a decent relative strength ranking of 75. The relative strength ranking is lower than 80 because it has been in base mode.
The buy entry is off the hourly chart, where we see Friday’s action potentially setting up the first higher swing low. A move over the 20-period EMA is our buy trigger, which should also put the action above the red downtrend line.
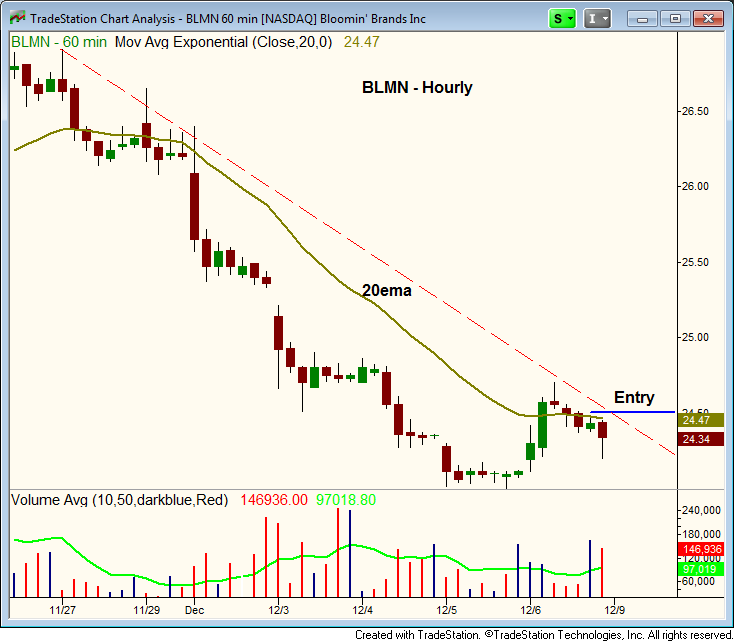
The entry does not have to be perfect here, as we are looking for $BLMN to hold the 50-day MA. Our stop is fairly loose to give the setup a chance to bottom out.