market timing model: Buy
Current signal generated on close of September 9.We are no longer in confirmed buy mode, but remain in buy mode. Portfolio exposure depends on how well positions have held up, but anywhere from 50% to 100% is okay (if positions are in good shape). Anything less than 50% long exposure right now is too light.
Past signals:
- Neutral signal generated on close of August 15
- Buy signal generated on close of July 11
- Neutral signal generated on close of July 5
- Sell signal generated on close of June 24
today’s watchlist (potential trade entries):

Having trouble seeing the open positions graphic above? Click here to view it directly on your web browser instead.
open positions:
Below is an overview of all open positions, as well as a report on all positions that were closed only since the previous day’s newsletter. Changes to open positions since the previous report are listed in pink shaded cells below. Be sure to read the Wagner Daily subscriber guide for important, automatic rules on trade entries and exits. Click here to learn the best way to calculate your share size.

Having trouble seeing the open positions graphic above? Click here to view it directly on your web browser instead.
closed positions:
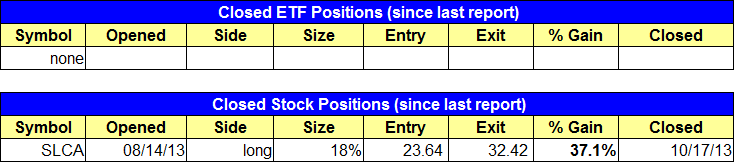
Having trouble seeing the closed positions graphic above? Click here to view it directly on your web browser instead.
ETF position notes:
- $XRT and $SOXL buy entries triggered.
stock position notes:
- $SLCA triggered our stop for partial size and we are out with a 37% gaind. We canceled the $HIMX entry because we want to wait for some sort of shakeout or reversal bar to produce a lower risk entry point.
ETF, stock, and broad market commentary:
The leading market averages put in another solid day of gains, led by a 0.9% move in the small cap Russell 2000. The S&P 500 and NASDAQ Composite also closed with respectable gains of +0.6%. The Dow Jones continues to struggle, as it closed slightly negative on the day but basically flat at -0.1%. The divergence in the Dow is a concern, but not in the short-term, as we feel there is enough strength in leadership stocks to lift the market higher for the next 4 to 8 weeks.
Yesterday’s advance in the S&P 500 put the index at a new closing high for the year, which is a great sign considering where this index was only six sessions ago! Turnover was lighter, on the NYSE but increased once again on the NASDAQ, as the tech heavy index continues to extend above the prior swing high.


SPDR S&P Bank ETF ($KBE) is finally back on track, which is a good sign for the S&P 500 after spending 6-weeks below the 10-week MA. The relative weakness in $KBE since late August was a clear drag on the S&P 500, but last week’s break of the downtrend line was followed up nicely by this week’s solid advance.

As ETF trend traders, we want to focus on ETFs that are making higher highs and higher lows with patterns that are showing relative strength to the S&P 500, or at the very least performing as well as the S&P 500. Pattern relative strength is a pretty simple tool one can use to eliminate certain groups from a watchlist. Any ETF that has broken out the past few weeks has great relative strength to the S&P 500 (think $TAN). ETFs that are breaking out this week along with the S&P 500 are also decent buys and may eventually outperform during the rally, like $SOXL. However, it is best to avoid groups that are lagging such as the homebuilders or REITs.
The chart below details the price action in Real Estate ETF $IYR vs. the S&P 500 ETF ($SPY).

On the stock side, buy orders triggered in $SFUN and $URI. $URI didn’t exactly go the way we expected on the open (we were looking for a gap up), but the volume and closing action was very strong, which is all we can ask of a stock that is breaking out to new highs. Volume on the weekly chart should be more than double its average by Friday’s close, which is a great sign.
Our stop triggered for partial size in $SLCA, allowing us to lock in a 37% gain on 25% of the full position. We plan to hold $SLCA through the first pullback and will look to sell into strength on the next move out.
We have one new buy setup in $ONVO today, which continues to trade in a tight range on the weekly chart. Currently, $ONVO is forming a tight, inside week, but we look for the action to rocket higher from here if it can clear last week’s high. The stop is just below this week’s low.
