Buy
– Signal generated on the close of April 30
Due to the recent distribution in the Nasdaq, we are no longer in confirmed buy mode (now is not the time to step on the gas). We remain in buy mode, but if market conditions continue to deteriorate the timing model will shift to sell mode.
today’s watchlist (potential trade entries):

Having trouble seeing the open positions graphic above? Click here to view it directly on your web browser instead.
open positions:
Below is an overview of all open positions, as well as a report on all positions that were closed only since the previous day’s newsletter. Net P/L figures are based a $100,000 model portfolio. Changes to open positions since the previous report are listed in pink shaded cells below. Be sure to read the Wagner Daily subscriber guide for important, automatic rules on trade entries and exits.

Having trouble seeing the open positions graphic above? Click here to view it directly on your web browser instead.
closed positions:

Having trouble seeing the closed positions graphic above? Click here to view it directly on your web browser instead.
ETF position notes:
- No trades were made.
stock position notes:
- $SLCA triggered its stop loss and we are out.
ETF, stock, and broad market commentary:
Stocks failed to follow through on Monday’s bullish reversal action and sold off most of the day, with all indices closing in negative territory. A bounce in the final hour of trading allowed the averages to close off the lows of the session, but still in the bottom third (or so) of the day’s range.
Lighter volume on both exchanges prevented the Nasdaq and S&P 500 from suffering another distribution day. As we have mentioned in the past, our timing model is based on the price and volume action of broad market averages and leading stocks. The volume pattern in the NYSE and Nasdaq has turned bearish over the past few weeks, which places all the burden on the leading stock portion of the model (which has held up all year). If leading stocks continue to hold up, then we would expect the current correction to be shallow or short lived. If leading stocks break down en masse, then we could potentially see a deeper correction.
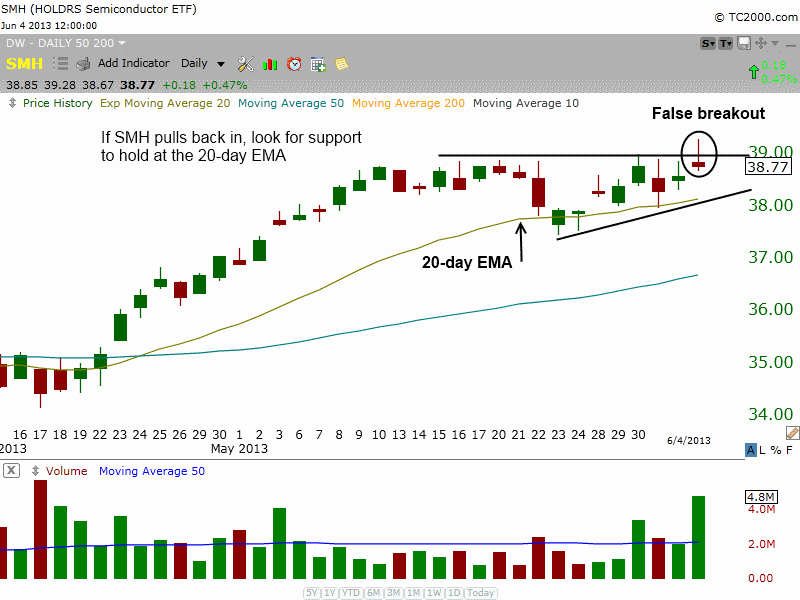
A stalled breakout attempt in Merrill Lynch Semiconductors HOLDRS ETF ($SMH) led to a close in the bottom 20% of the day’s range. If Tuesday’s low does not hold over the next two days, then we would expect a short-term pullback to the 20-day EMA. Because of this, we are lowering our stop back down to the original stop point to give the setup some breathing room (around the 20-day EMA). Since we sold 2/3 of our position on the move up, we don’t mind holding on to the rest of the position with a loose stop placed beneath the swing low of 5/23.

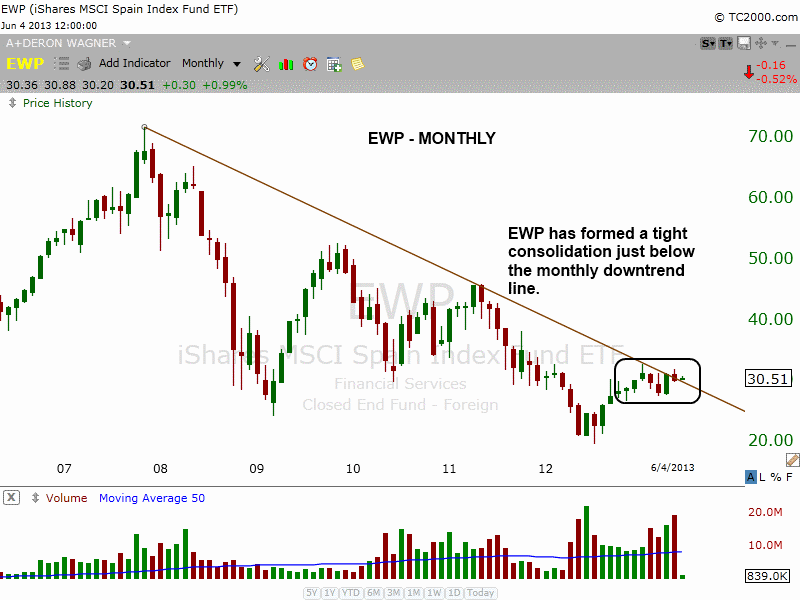
While many pacific rim ETFs have taken a beating the past few weeks, we are seeing some stability from Europe with the iShares MSCI Spain ($EWP) consolidating above its 50-day moving average on a daily chart. The monthly chart below shows $EWP trading just below the downtrend line:

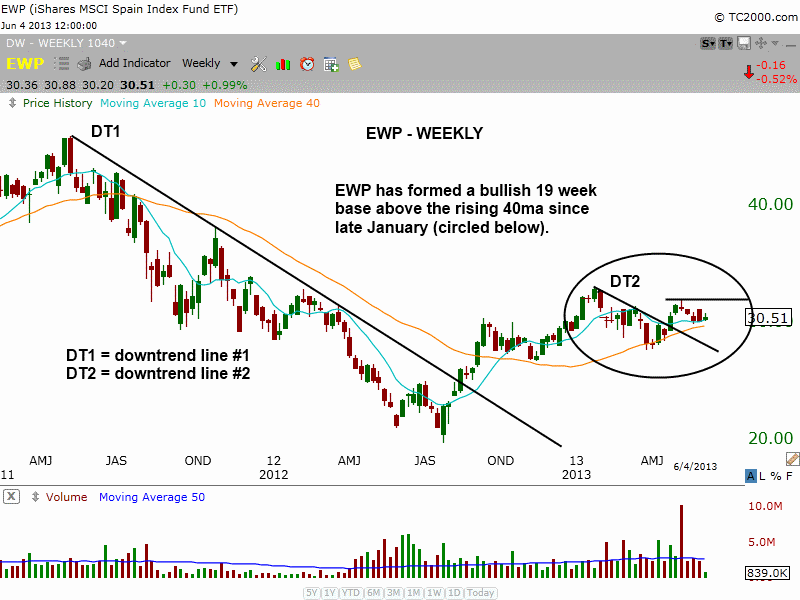
The weekly chart below shows the recent strength in $EWP since it cleared the weekly downtrend line (DT1) last summer. After stalling out at $32 in January, the price action has pulled back to the (now) rising 40-week MA and held. Now that the short-term downtrend line (DT2) is broken and $EWP is back above the 10-week MA, we can look for the price action to tighten up and potentially form a low risk entry point in the next few weeks. A move above $33 would produce a breakout on multiple time frames (monthly and weekly), which is always a bullish sign.

On the stock side we ran in to a bit of bad luck as $SLCA announced a secondary offering, and closed below the 50-day MA on a pick up in volume. We were stopped out of our position below $20, which is well below the 50-day MA ( if $SLCA can’t hold the 50-day MA, then we do not want to be long).
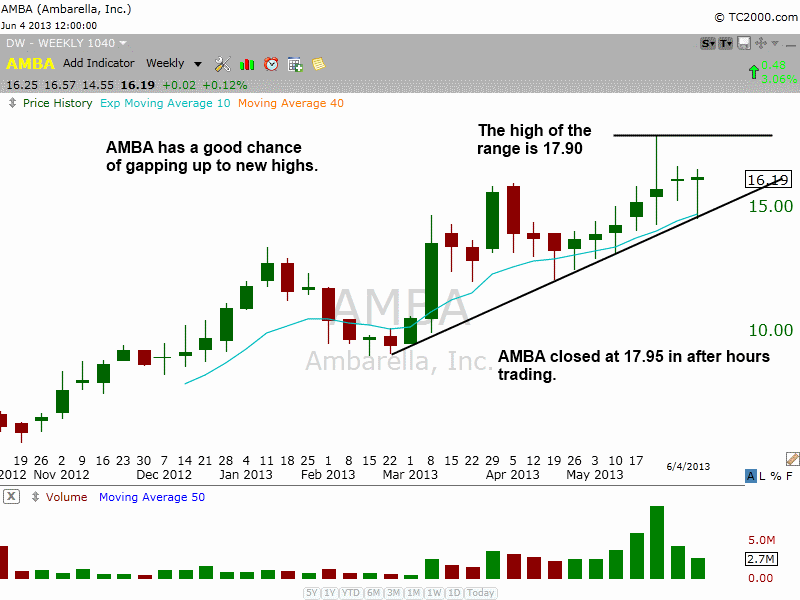
$AMBA closed at 17.95 in after hours trading yesterday in response to earnings. A move above $18 will send this recent IPO to new highs.

We are not looking to do too much right now as most charts are in need of one or two more weeks of consolidation to produce ideal buy points. The short-term plan is to sit tight in current positions and wait for new setups to emerge. Whether we sit tight for two days or two weeks will depend on the charts.