Confirmed Buy– Signal generated on the close of January 22 (click here for more details)
today’s watchlist (potential trade entries):

Having trouble seeing the open positions graphic above? Click here to view it directly on your web browser instead.
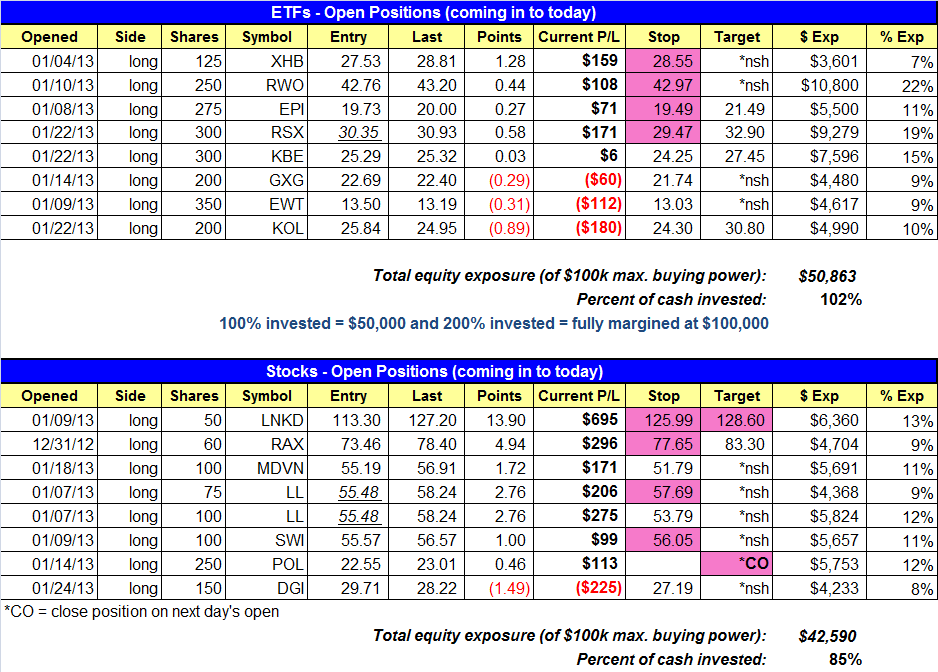
open positions:
Below is an overview of all open positions, as well as a report on all positions that were closed only since the previous day’s newsletter. Net P/L figures are based on two separate $50,000 model portfolios (one for ETFs and one for stocks). Changes to open positions since the previous report are listed in pink shaded cells below. Be sure to read the Wagner Daily subscriber guide for important, automatic rules on trade entries and exits.
Having trouble seeing the open positions graphic above? Click here to view it directly on your web browser instead.
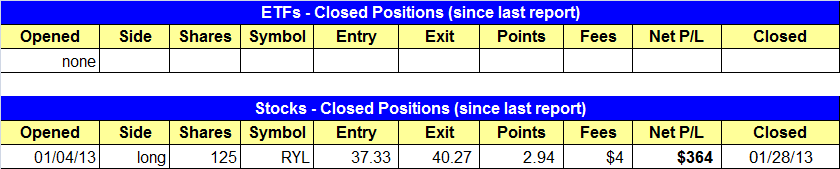
closed positions:
Having trouble seeing the closed positions graphic above? Click here to view it directly on your web browser instead.
ETF position notes:
- No trades were made.
stock position notes:
- $RLY sell stop triggered, locking in a $360 gain.
ETF, stock, and broad market commentary:
It was mixed day on Wall Street, with broad based averages basically chopping around all session long and closing in the -0.2% to +0.2% range. Turnover eased by 3% on the NYSE, while Nasdaq volume increased by less than 1%. There were no signs of institutional accumulation or distribution on the day, but the main indices are extended and vulnerable to a short-term pullback.
In the ETF portfolio, we tightened up stops on a few positions to reduce risk. We raised the stop in $XHB to protect gains, while the $RWO stop was moved to just below the two-day low to guard against a false breakout. $KOL continues to slide lower and it looks like the 50-day MA is our last line of defense.
We are not looking to add more long setups to the official watchlist, so today’s report we will cover a few ETFs that are consolidating near the highs and need a few more weeks of basing action to provide us with reliable entries.
The iShares FTSE/Xinhua China 25 Index ($FXI) is consolidating in a tight range near the highs of the last wave up, but it’s a bit too early in the base to begin buying, as we would like to see the price action establish one or two higher lows within the base.

When a stock or ETF enters pullback mode after a strong run up, we prefer to see the price action correct no more than 38% of the last wave up. On $FXI we measure from the base breakout at 35.70 to the high at 42.00. A 38% retracement of this move is around 38.80. So, if $FXI is to maintain the momentum of the last move up, the current consolidation should not break the 38.80 level.
iShares MSCI Poland ($EPOL) is another ETF in consolidation mode, but unlike $FXI, $EPOL failed to extend much beyond the last breakout pivot just below 28.00.

$EPOL must hold above the 50-day MA and establish one or two higher swing lows within the base over the next few weeks. As a guide, one could look for a break of the short-term downtrend line as a sign that the action is improving. To draw the short-term trendline, start from the high of Jan. 2 and connect the line to the high of Jan. 17.
On the stocks side, we do not have any new setups listed and the $CTRX setup has been canceled. $RYL hit our tight stop yesterday, and we are out with a $360 gain. We were pretty busy tonight deciding how to manage stops on existing positions. Below is a quick line or two regarding our thought process in each stock:
- $LNKD – Strong price action, we raised the stop to lock in gains and have a target in place. If the stop triggers first, we come away with a $630 profit at worst.
- $RAX – We are going with a very tight stop since in case the current breakout fails. $RAX has not impressed much on the move up as it has moved slower than expected.
- $MDVN – We are leaving the stop alone, but any pullback should find support at the 20-day EMA. We have to let some of these positions play out.
- $LL – We raised the stop on 75 shares due to the second day of stalling action at the $60.00 level. The stop on the remaining 100 shares remains the same.
- $SWI – Reports earnings next week, so we are not willing to sit through another pullback. As such, our stop is tight.
- $POL – Reports earnings after the close on Tuesday, so we are selling at market on the open.
- $DGI – No change in stop for now…if the reversal candle from 1/23 fails then we exit.
If you are a new subscriber, please e-mail [email protected] with any questions regarding our trading strategy, money management, or how to make the most out of this report.
relative strength combo watchlist:
Our Relative Strength Combo Watchlist makes it easy for subscribers to import data into their own scanning software, such as Tradestation, Interactive Brokers, and TC2000. This list is comprised of the strongest stocks (technically and fundamentally) in the market over the past six to 12 months. The scan is updated every Sunday, and this week’s RS Combo Watchlist can be downloaded by logging in to the Members Area of our web site.