Buy
– Signal generated on the close of April 30
We are now in confirmed buy mode, which means that we can go on margin if needed.
today’s watchlist (potential trade entries):

Having trouble seeing the open positions graphic above? Click here to view it directly on your web browser instead.
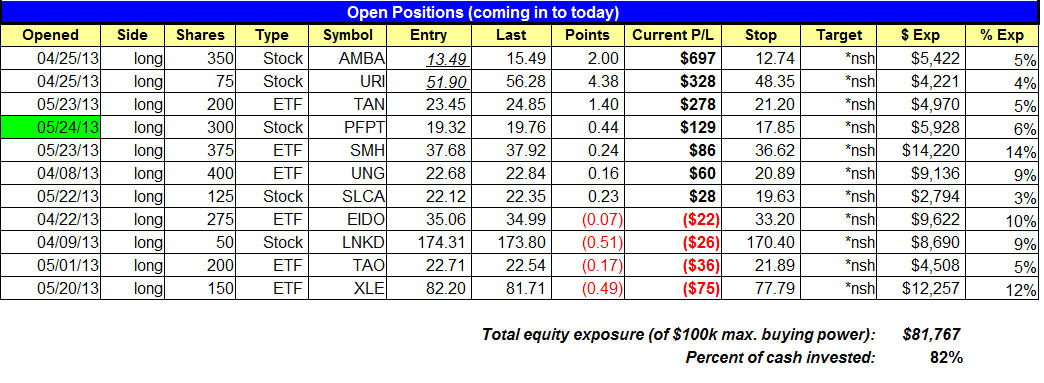
open positions:
Below is an overview of all open positions, as well as a report on all positions that were closed only since the previous day’s newsletter. Net P/L figures are based a $100,000 model portfolio. Changes to open positions since the previous report are listed in pink shaded cells below. Be sure to read the Wagner Daily subscriber guide for important, automatic rules on trade entries and exits.

Having trouble seeing the open positions graphic above? Click here to view it directly on your web browser instead.
closed positions:

Having trouble seeing the closed positions graphic above? Click here to view it directly on your web browser instead.
ETF position notes:
- No trades were made.
stock position notes:
- $PFPT buy entry triggered.
ETF, stock, and broad market commentary:
Stocks concluded a negative week on a calm note last Friday, as the S&P 500, Dow Jones Industrial Average, and Nasdaq Composite settled the day within 0.1% of the flat line. As is often the case, turnover was light ahead of the holiday weekend. Total volume in both exchanges was more than 20% lighter than the previous day’s levels. Overall it was a quiet, flat session, which was encouraging that the bears did not step back in to resume the May 22 selling. Despite the pullback that began last Wednesday, it was only the first weekly decline of the past five weeks. Further, there has only been one confirmed “distribution day” during the same period.
Last Thursday, one day after the first significant broad market decline in more than a month, we targeted two ETFs with relative strength for potential pullback entry in the event of follow-through bearish momentum the following morning. Both setups of Guggenheim Solar ETF ($TAN) and Market Vectors Semiconductor ($SMH) triggered our pullback entry prices and have been looking good since then.
The rather volatile $TAN is already showing an unrealized gain of 6.0% since our May 23 buy entry of $23.45 (where we grabbed some shares on a pullback to the 10-day MA). From here, we would ideally like to see the ETF build a base of consolidation near the highs, then breakout to a new high within the next several weeks.
The other trade we entered last Thursday was $SMH, which we swiped as it pulled back to test substantial near-term support of its 20-day exponential moving average for the first time since its breakout. The following day, $SMH formed a bullish “hammer” candlestick and closed above its 20-day EMA for the second straight day. Take a look:

Based on the healthy pullback of $SMH that is holding the 20-day EMA, the ETF should be well positioned to climb back to the highs as long as the broad market holds steady. If we get a little bit of help from the market, in the form of a bounce this week, $SMH should be among the first industry sector ETFs to outperform due to the relative strength $SMH was exhibiting on the way up.
On May 6, iShares Malaysia Index Fund ($EWM) gapped up 6% to a fresh all-time high. Since this was a confirmed “breakaway gap,” we have been stalking this ETF for the past several weeks, waiting for a base of consolidation to form and the moving averages to rise up and provide support. Last Friday, $EWM gapped down to “undercut” support of its 20-day exponential moving average:

From here, we will be watching to see if $EWM forms some sort of bullish reversal bar and closes back above the 20-day EMA. If it does, it could present a possible buying opportunity the following day (above the prior day’s high). For now, it is not actionable on today’s watchlist, but we will be sure to notify you if/when we decide to buy as an “official” swing trade on our watchlist.
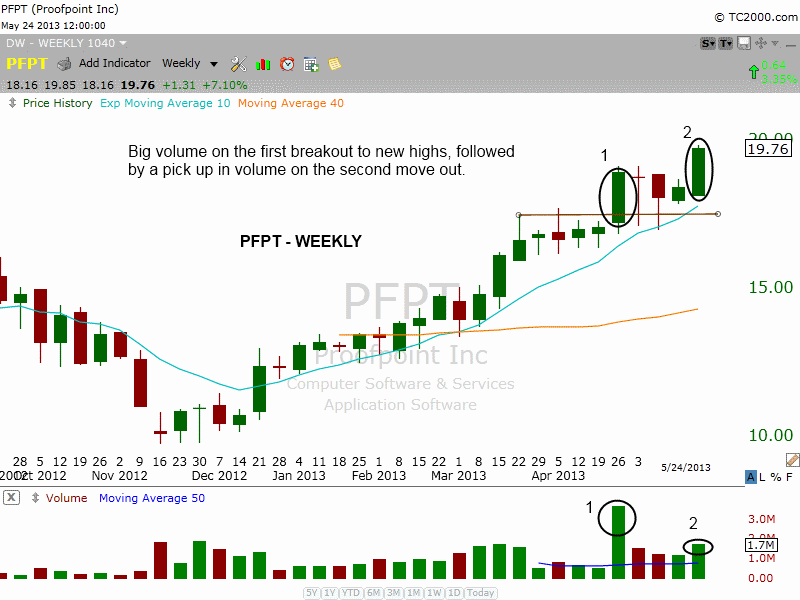
On the stock side, PFPT was added to the portfolio on a breakout to new highs. Looking at the weekly chart below, we can clearly see the bullish price and volume pattern over the past five weeks. The first week is the 250% spike in volume on the breakout in late April, which was followed by three weeks of light volume consolidation. Volume picked up once again on the continuation breakout last week.

We have one new setup in Sunesis Pharm. – $SNSS. The monthly chart below shows the tight consolidation in $SNSS after clearing a long-term, monthly downtrend line.

On the daily chart we see a tight ranged (and light volume) consolidation in place for several months. The buy entry is over last week’s high. The low of the bullish reversal candle on 5/23 presents us with a logical stop, as it is also below the 10, 20, and 50-day MAs. We are keeping the size small (at 5% of portfolio equity) because this stock does not trade with much volume. Rather than pass on a good setup, we just lower the share size and take what we can. However, for this newsletter we will not dip below the 100k average volume level for stock trades, though we will occasionally dip below that level for ETF trades.